Debugging - The process of identifying errors in programming code is called debugging.
Debugging is inevitable when you start writing the code. It is the very much next act for the line of code you write.
Until you get the expected behavior what you are actually doing is coding & debugging. Hence knowing different debugging techniques is very much important.
Javascript is the underlying language for all front-end libraries and knowing how to debug is very much useful.
There are three main types of errors that occur while coding in javascript. Those are:
Syntax Errors: These are the mistakes in source code like spelling mistakes, punctuations, incorrect labels, which can cause error messages generated at compile time.
Most of these are visible in your IDE and we can easily correct and resolve them.

Runtime Errors: Occurs during the runtime of the program after being interpreted by the compiler.

Before compilation, there is no error but while running it has thrown an error.
Logical Errors: Program executes successfully but generates unintended results.

You intended to compare but you assigned. Hence first became 20.
Ok.
Without the knowledge of errors, there is no point in discussing debugging. Hence that part is over and let's start debugging now.
Syntax errors can be resolved upfront as such no techniques are needed. Run-time errors are usually logged in browser console with very much possible stack trace and can be resolved easily.
The tricky part is logical errors where we are really required to apply debugging techniques.
1. console.log
The primary technique is to log the result of your logic to see whether the result is intended or not. This will log to your browser console.
Follow the below steps to open the browser developer tools (which includes console) in the browser:
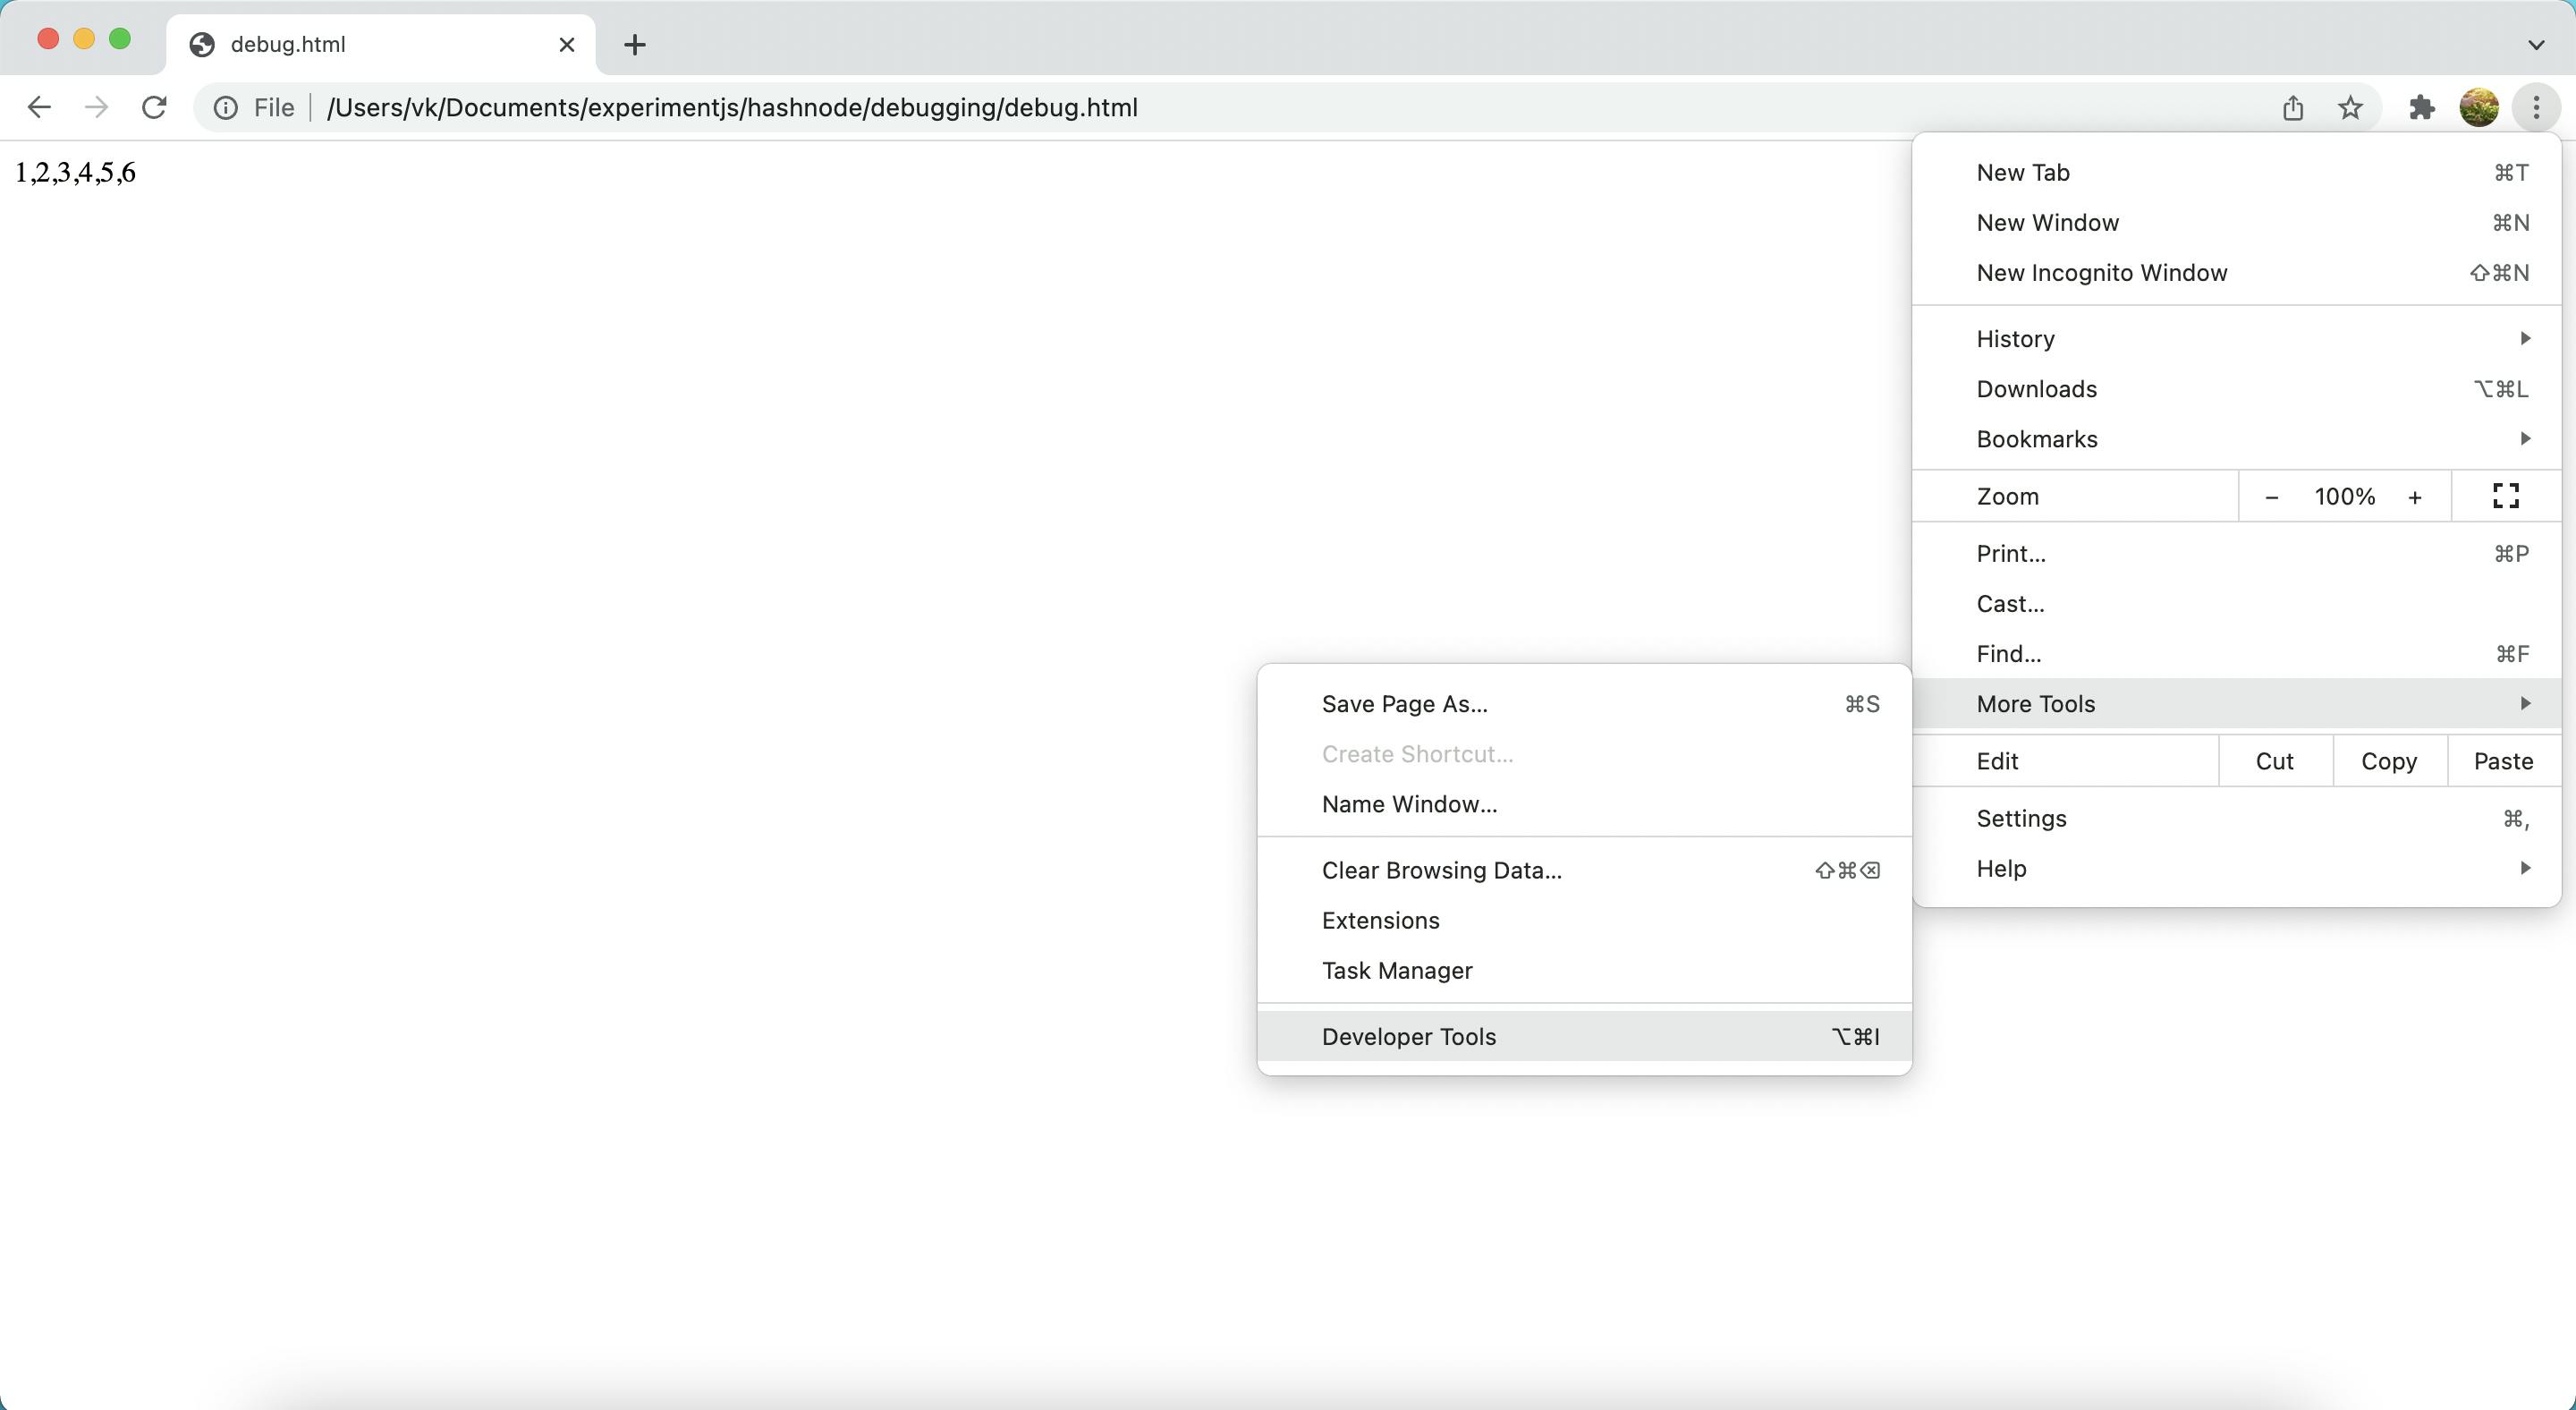
example:
<html>

<body>
    <p id="arr">
    </p>
    <script>
        const arr = [1, 2, 3, 4, 5];
        arr.push(6);

        // Print in console to validate.
        console.log(arr);
        document.getElementById('arr').innerHTML = arr;
    </script>
</body>

</html>
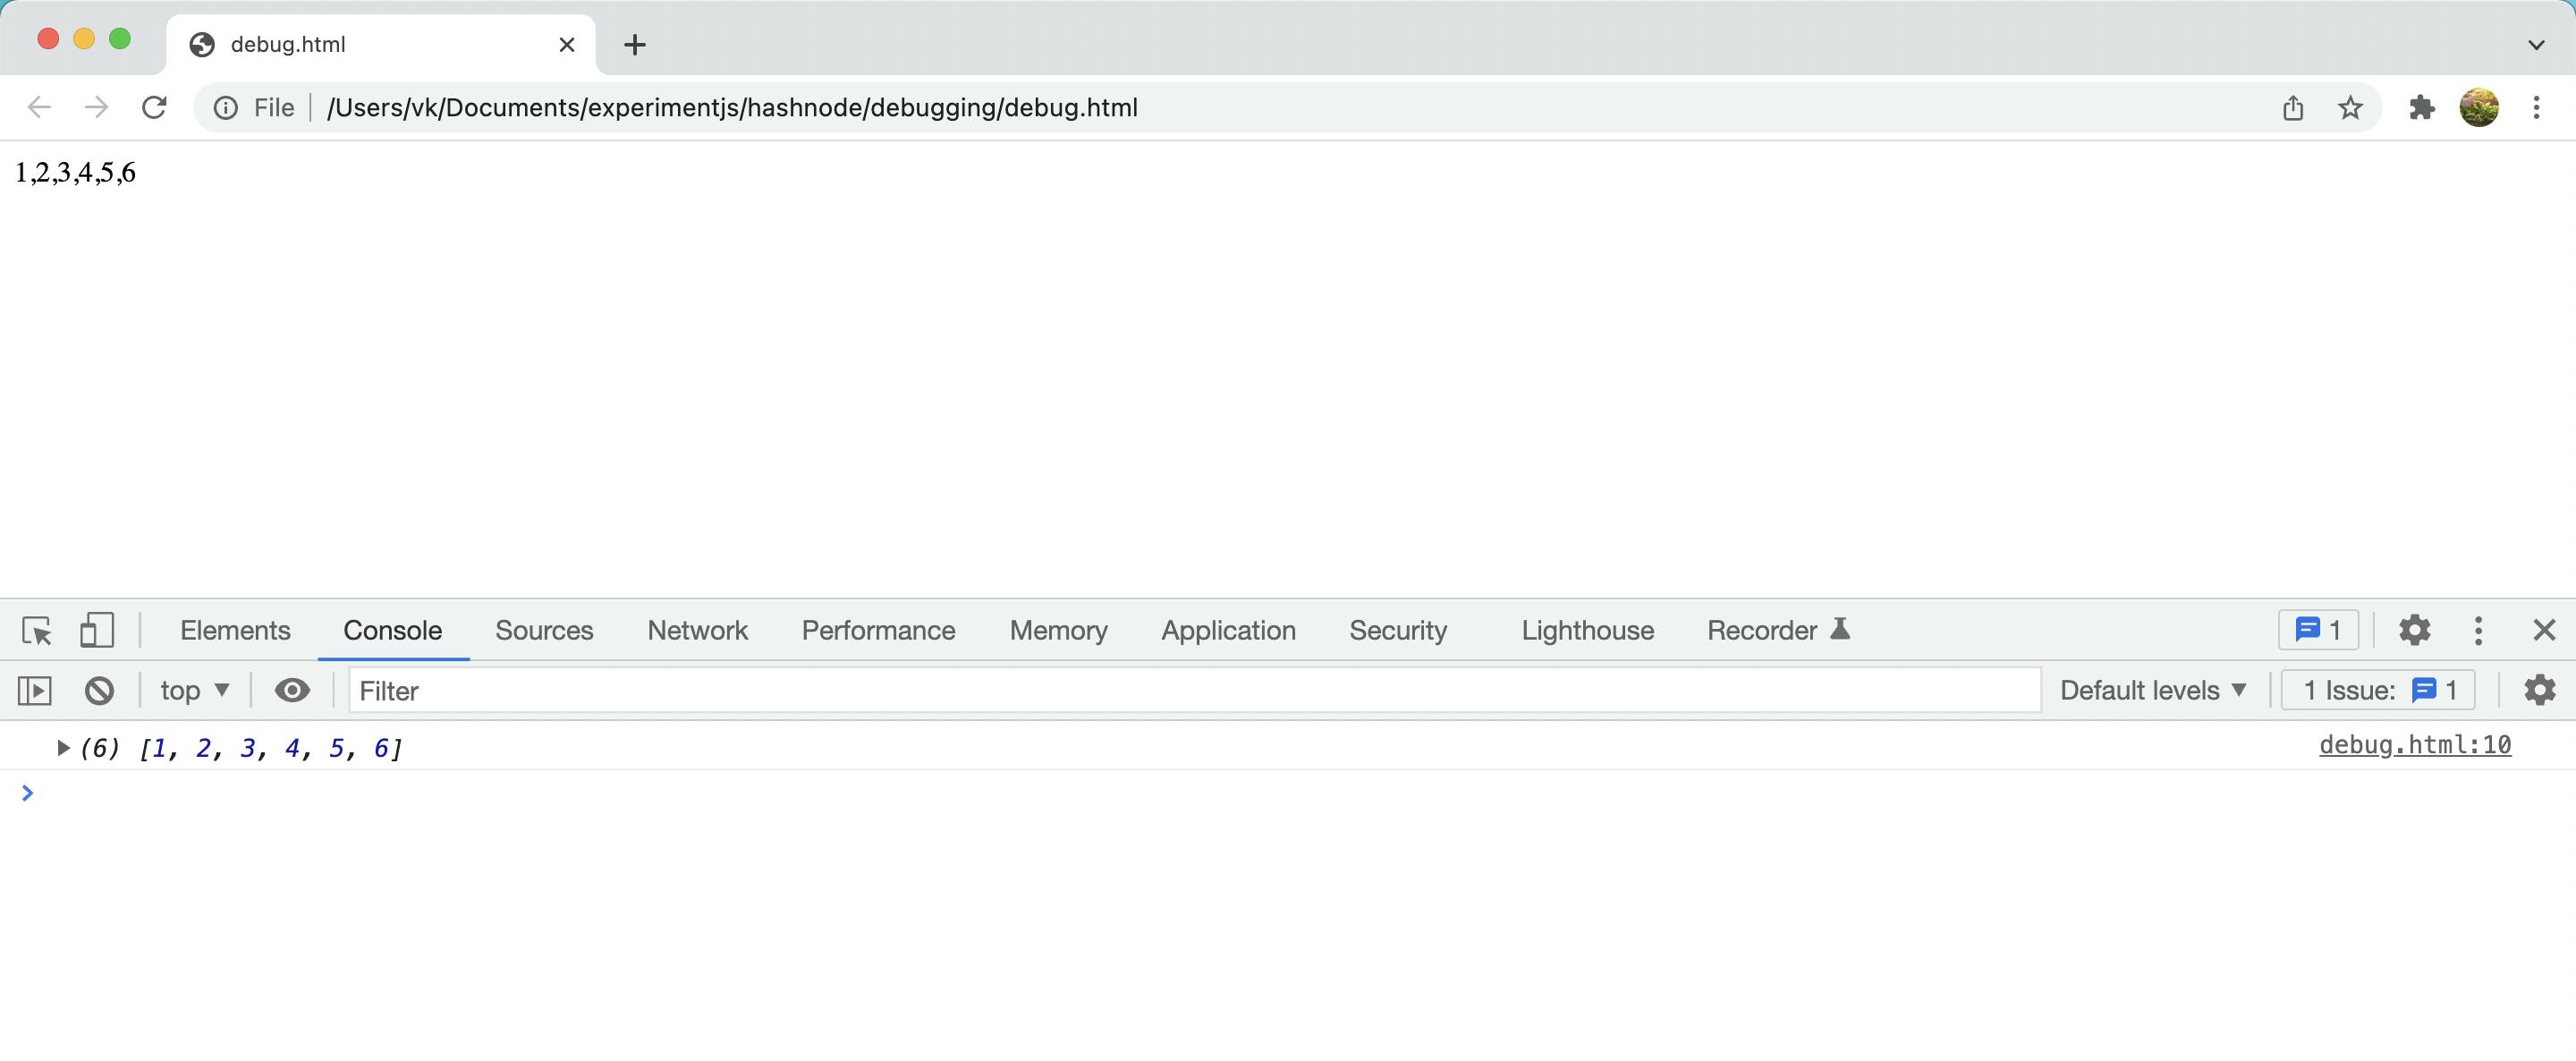
The above one is a simple example though whenever you see that your result is not intended you can log and verify in the same way. Ensure to remove console log statements once you resolve the issue from code.
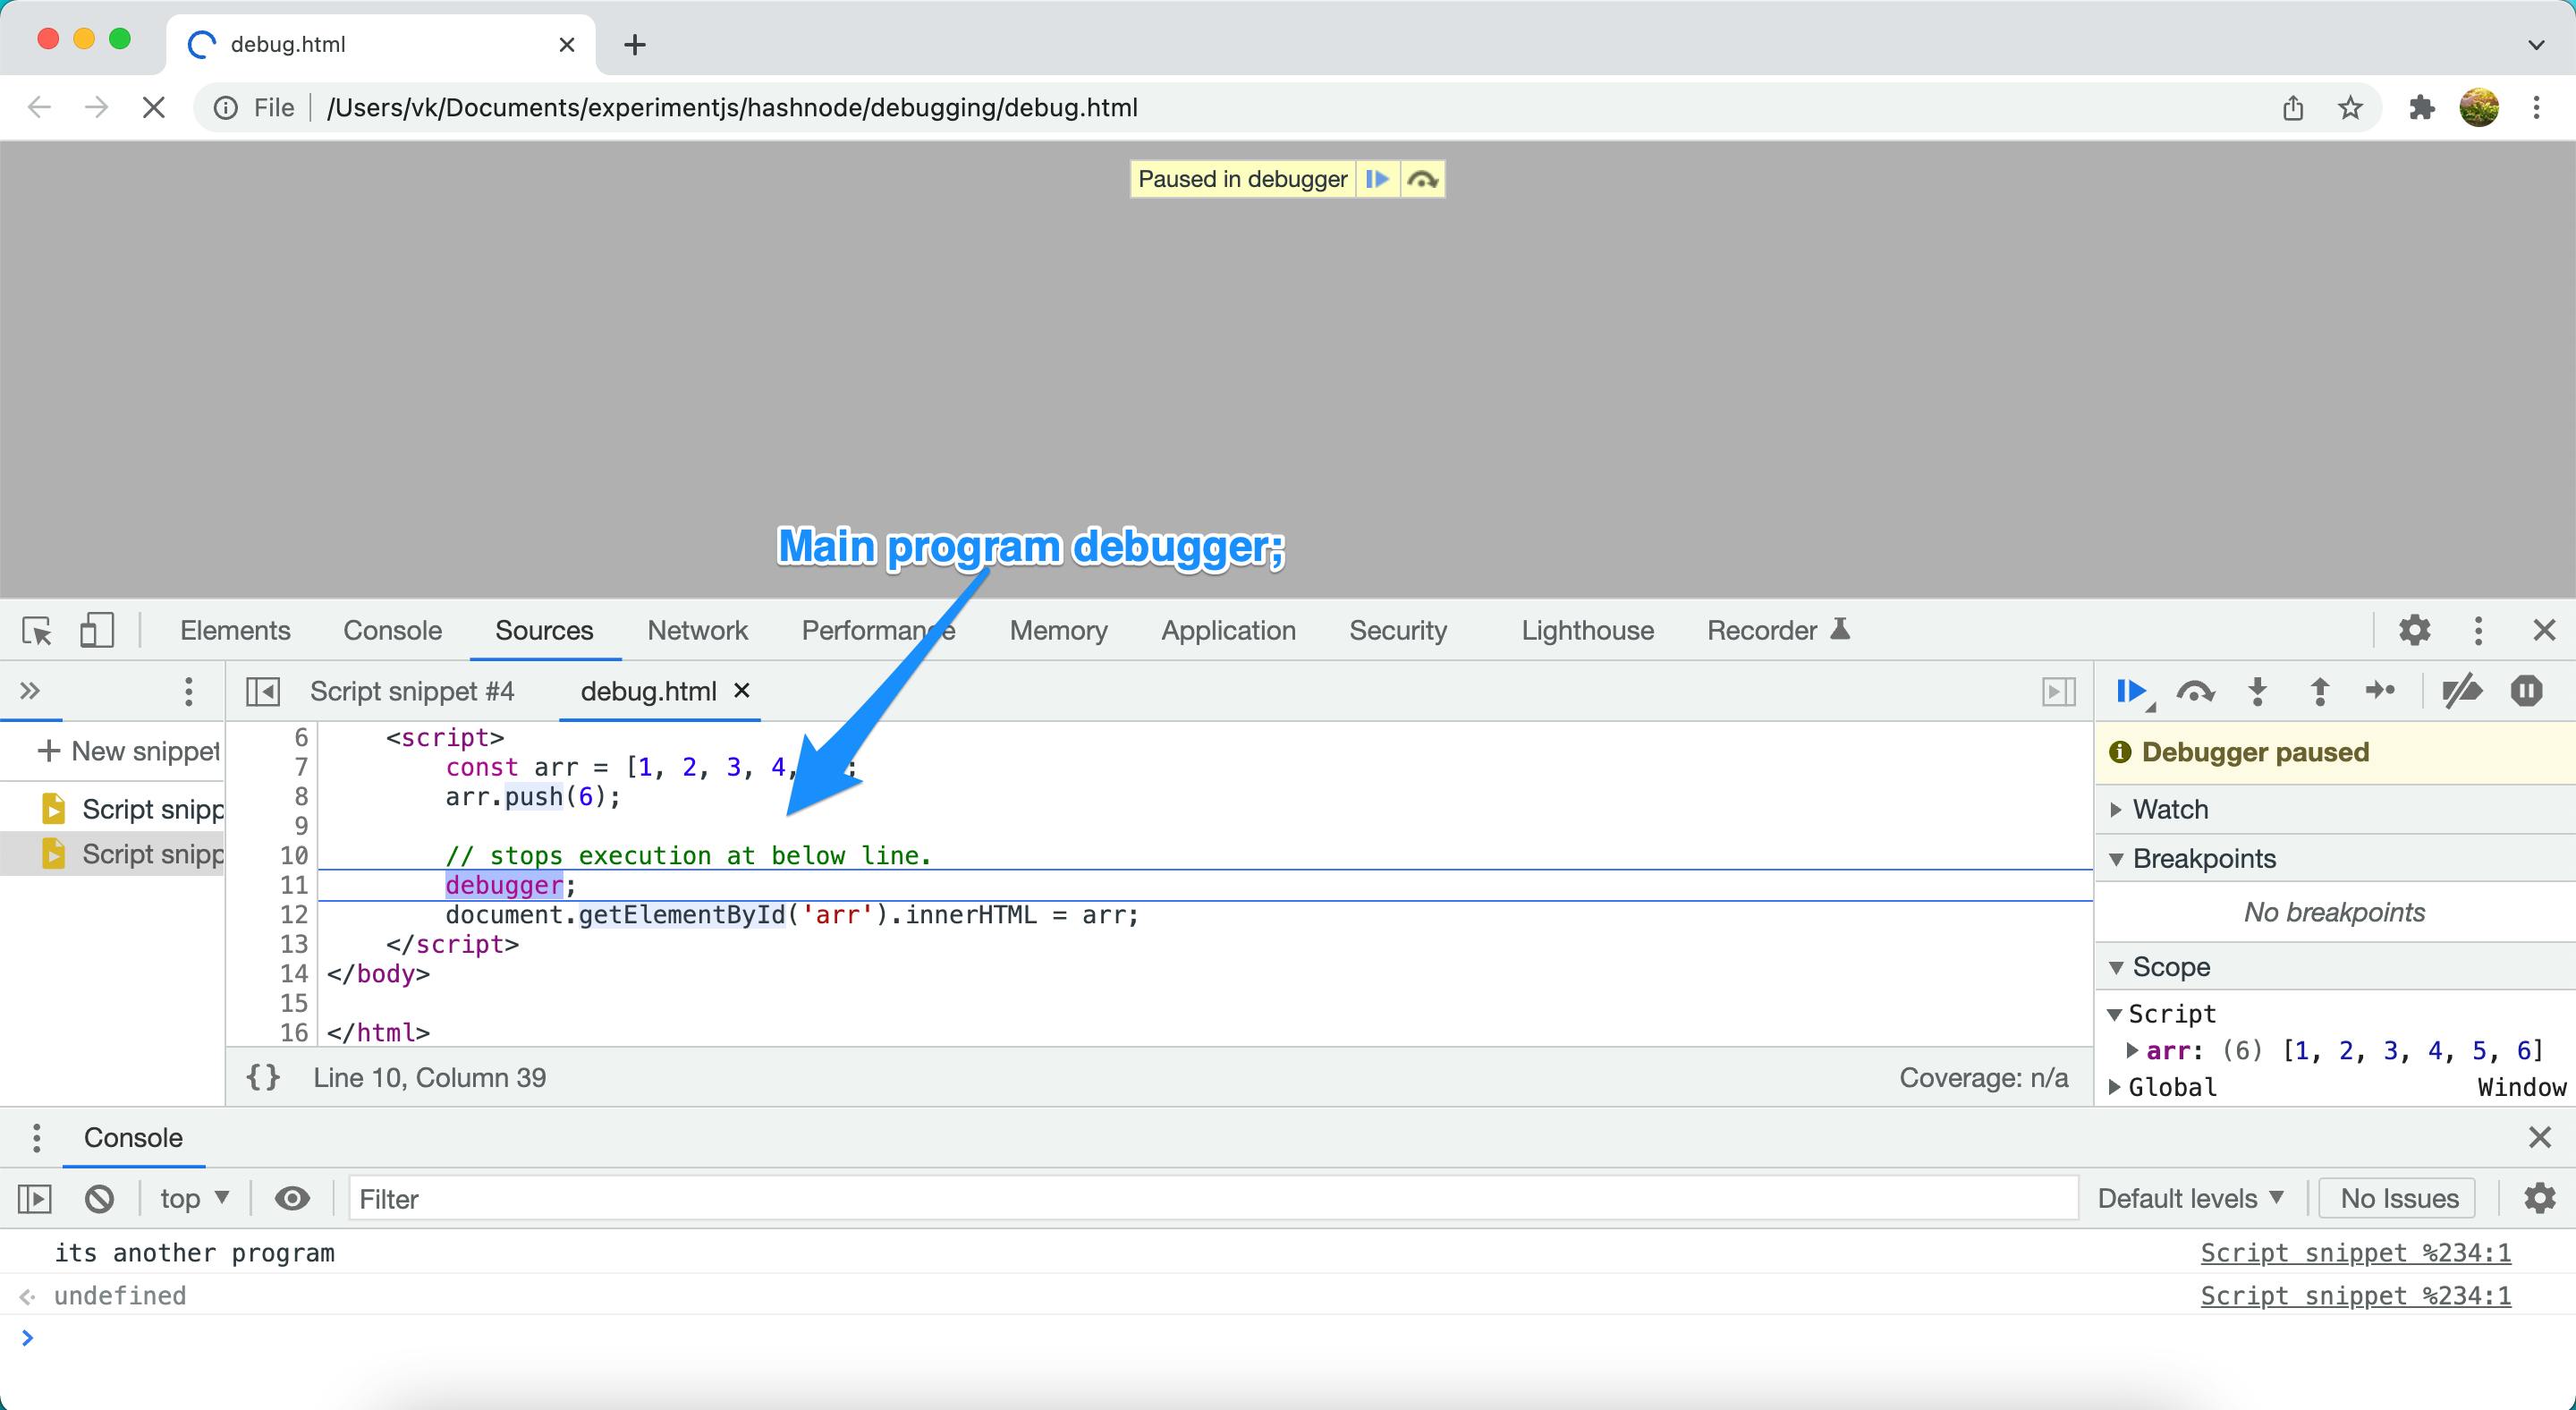
2. debugger;
It is a keyword that is used to stop the execution of javascript and calls the debugging function. You can use browser debugging options to validate the result. This also works only when you restart the application by opening browser developer tools.
<html>

<body>
    <p id="arr">
    </p>
    <script>
        const arr = [1, 2, 3, 4, 5];
        arr.push(6);

        // stops execution at below line.
        debugger;
        document.getElementById('arr').innerHTML = arr;
    </script>
</body>

</html>
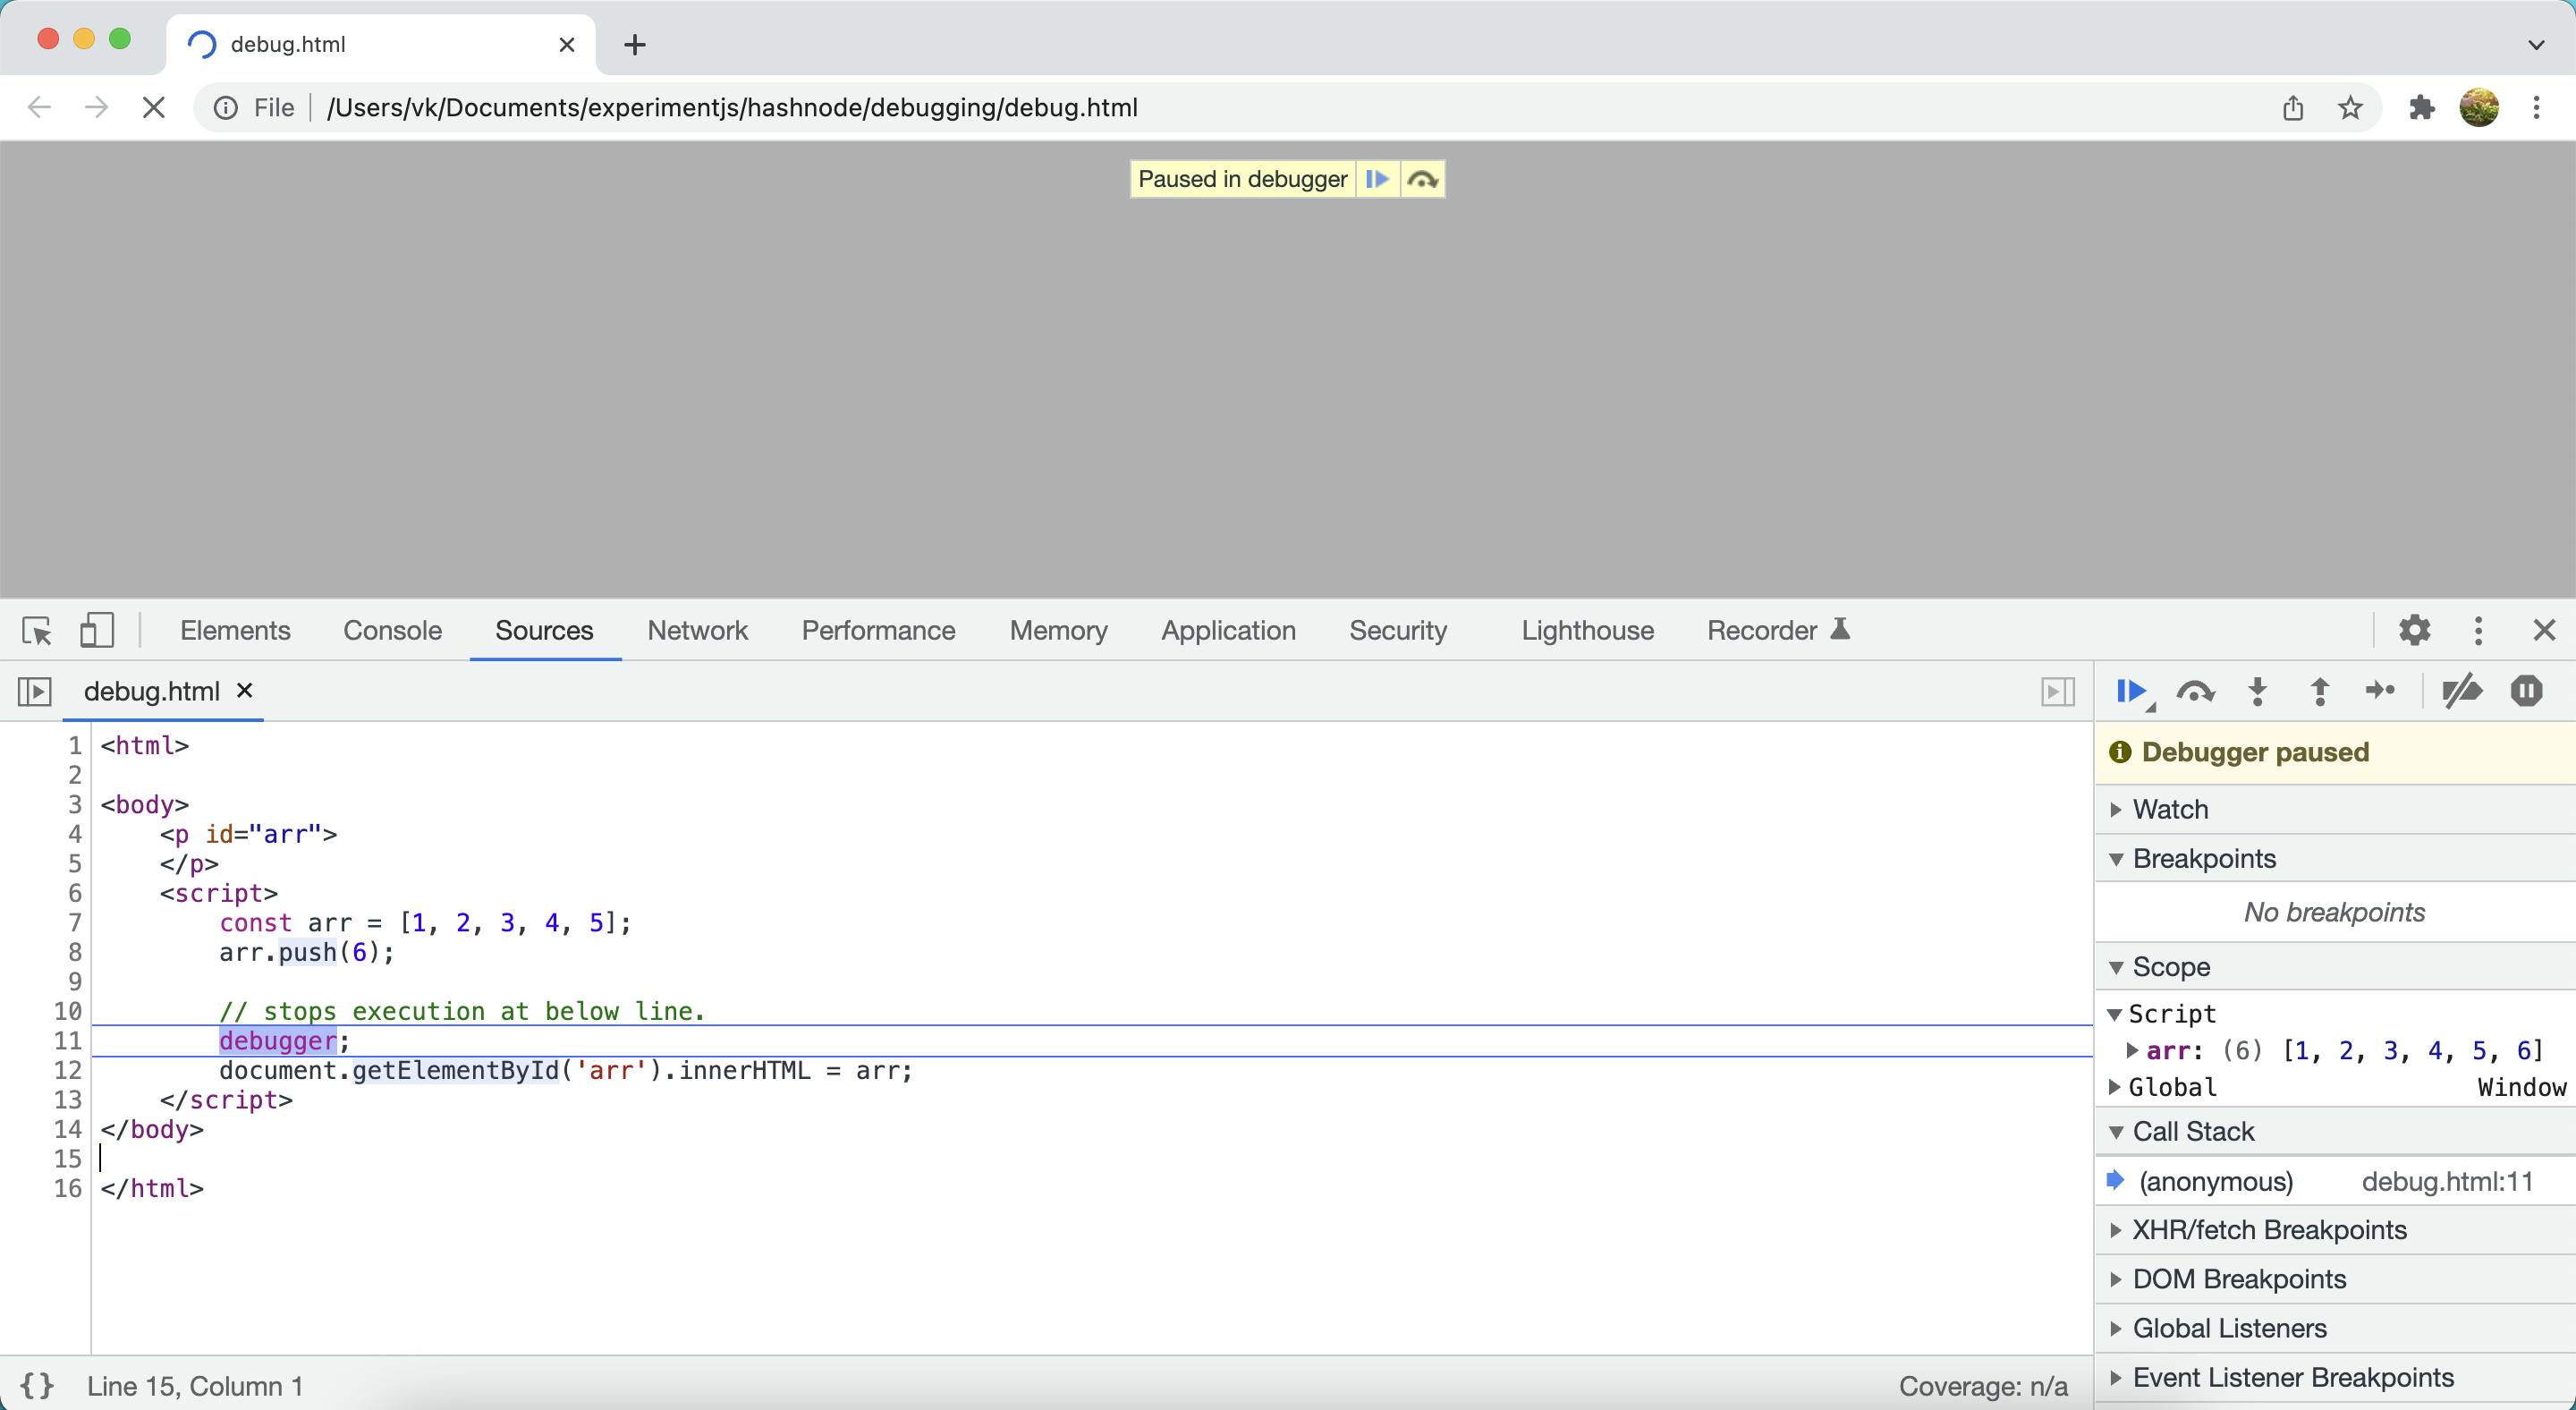
3. Browser Debugging Options
Same as debugger;, browser breakpoint also stops execution and lets you walk through each line of code to validate the result.
Open developer tools -> Navigate to sources -> Click on left nav on line numbers to add breakpoint -> reload the application
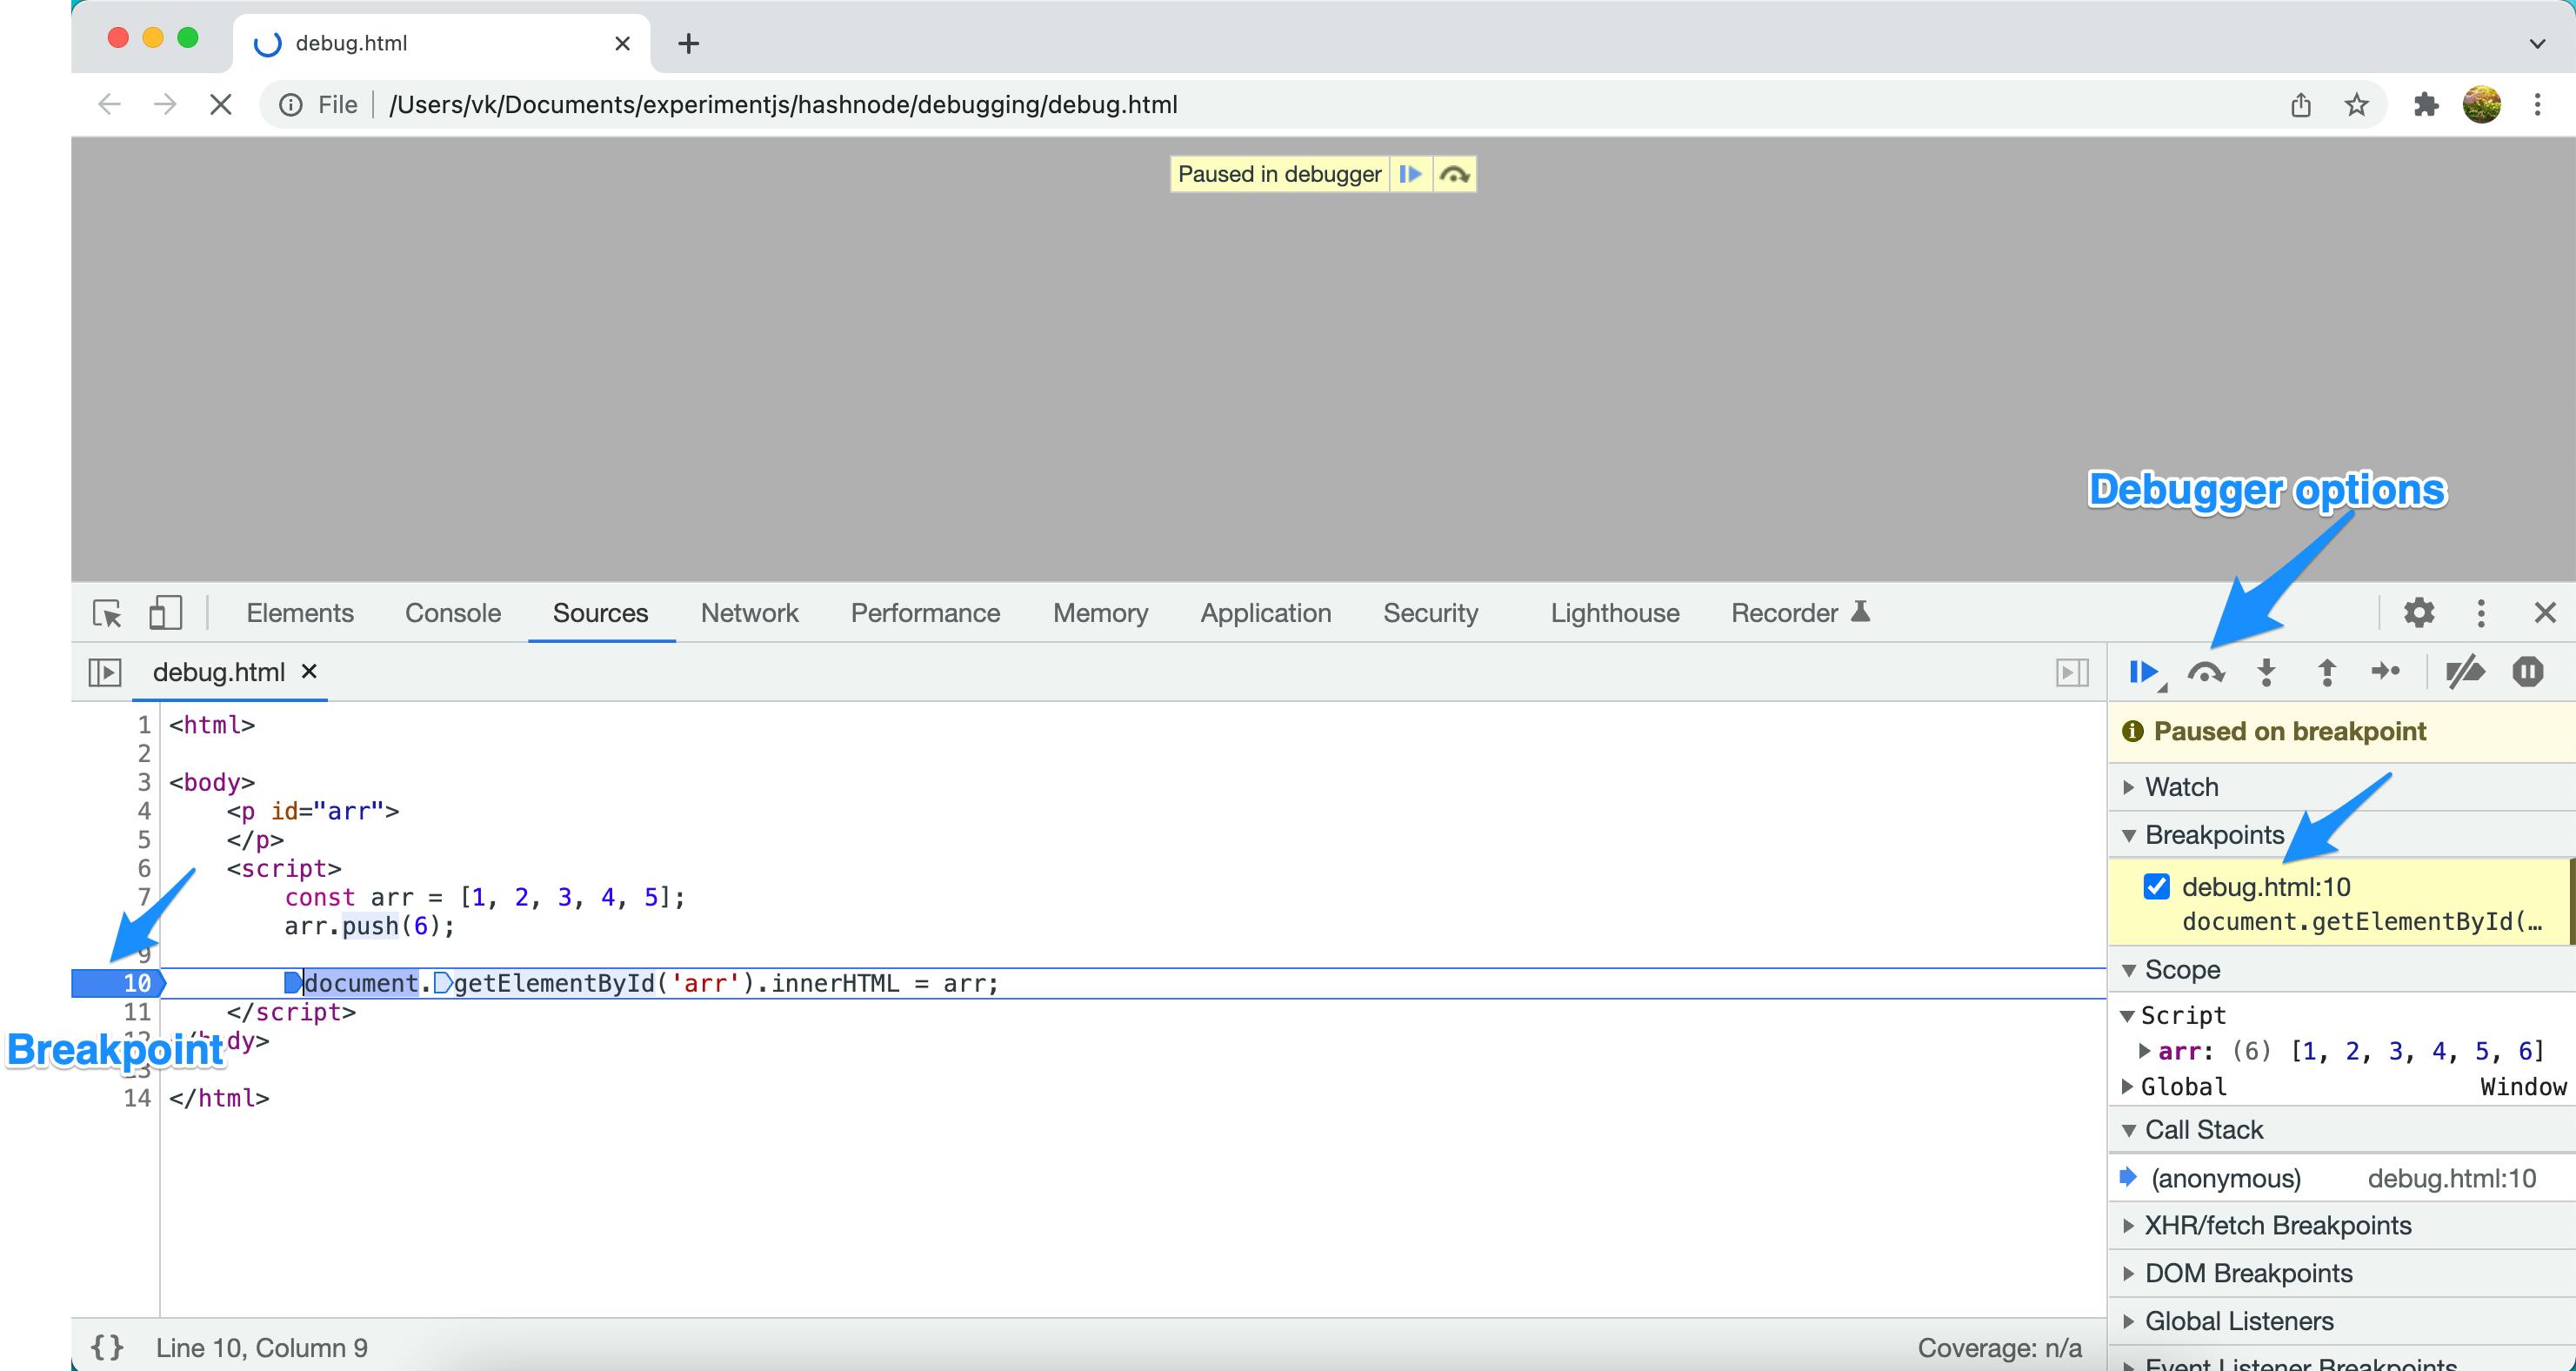
4. Use Sources tab
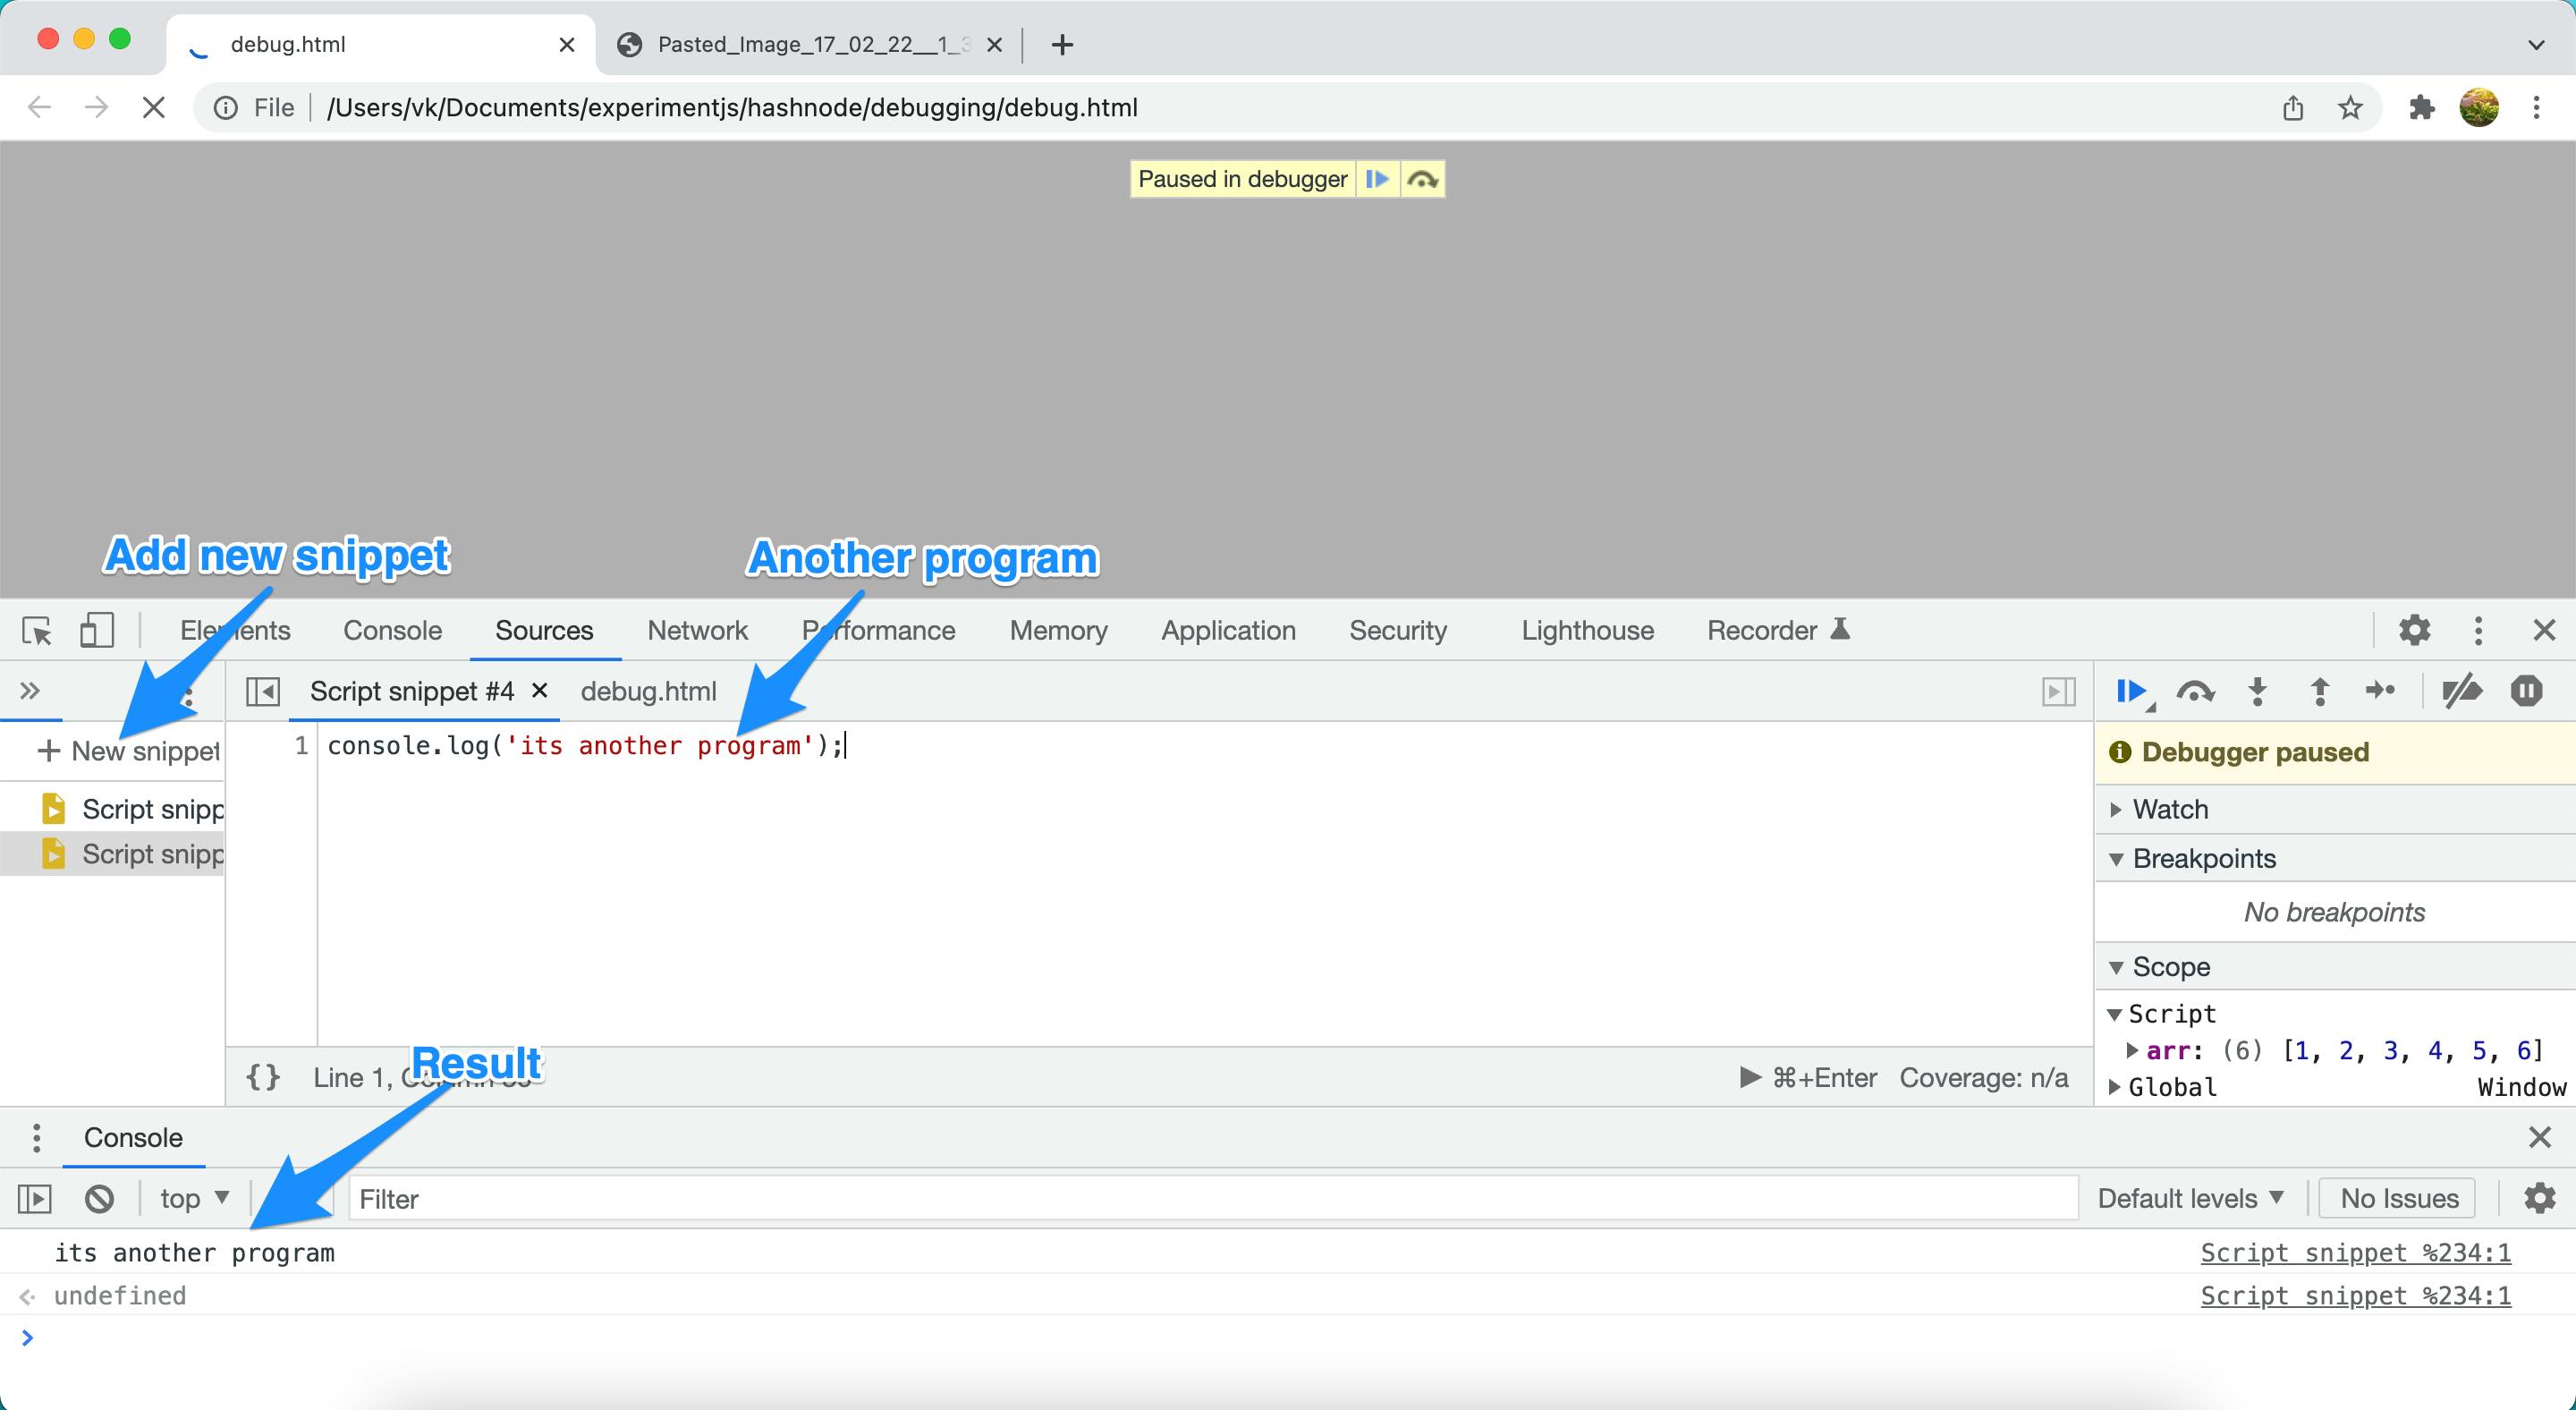
There might be situations where you want to verify some code snippet even while debugging the main application code.
Open developer options -> Go to Sources tab -> Click on New Snippet in left nav -> new file added in mid pannel -> write another program -> Click enter to run program.
5. Device Mode in browser
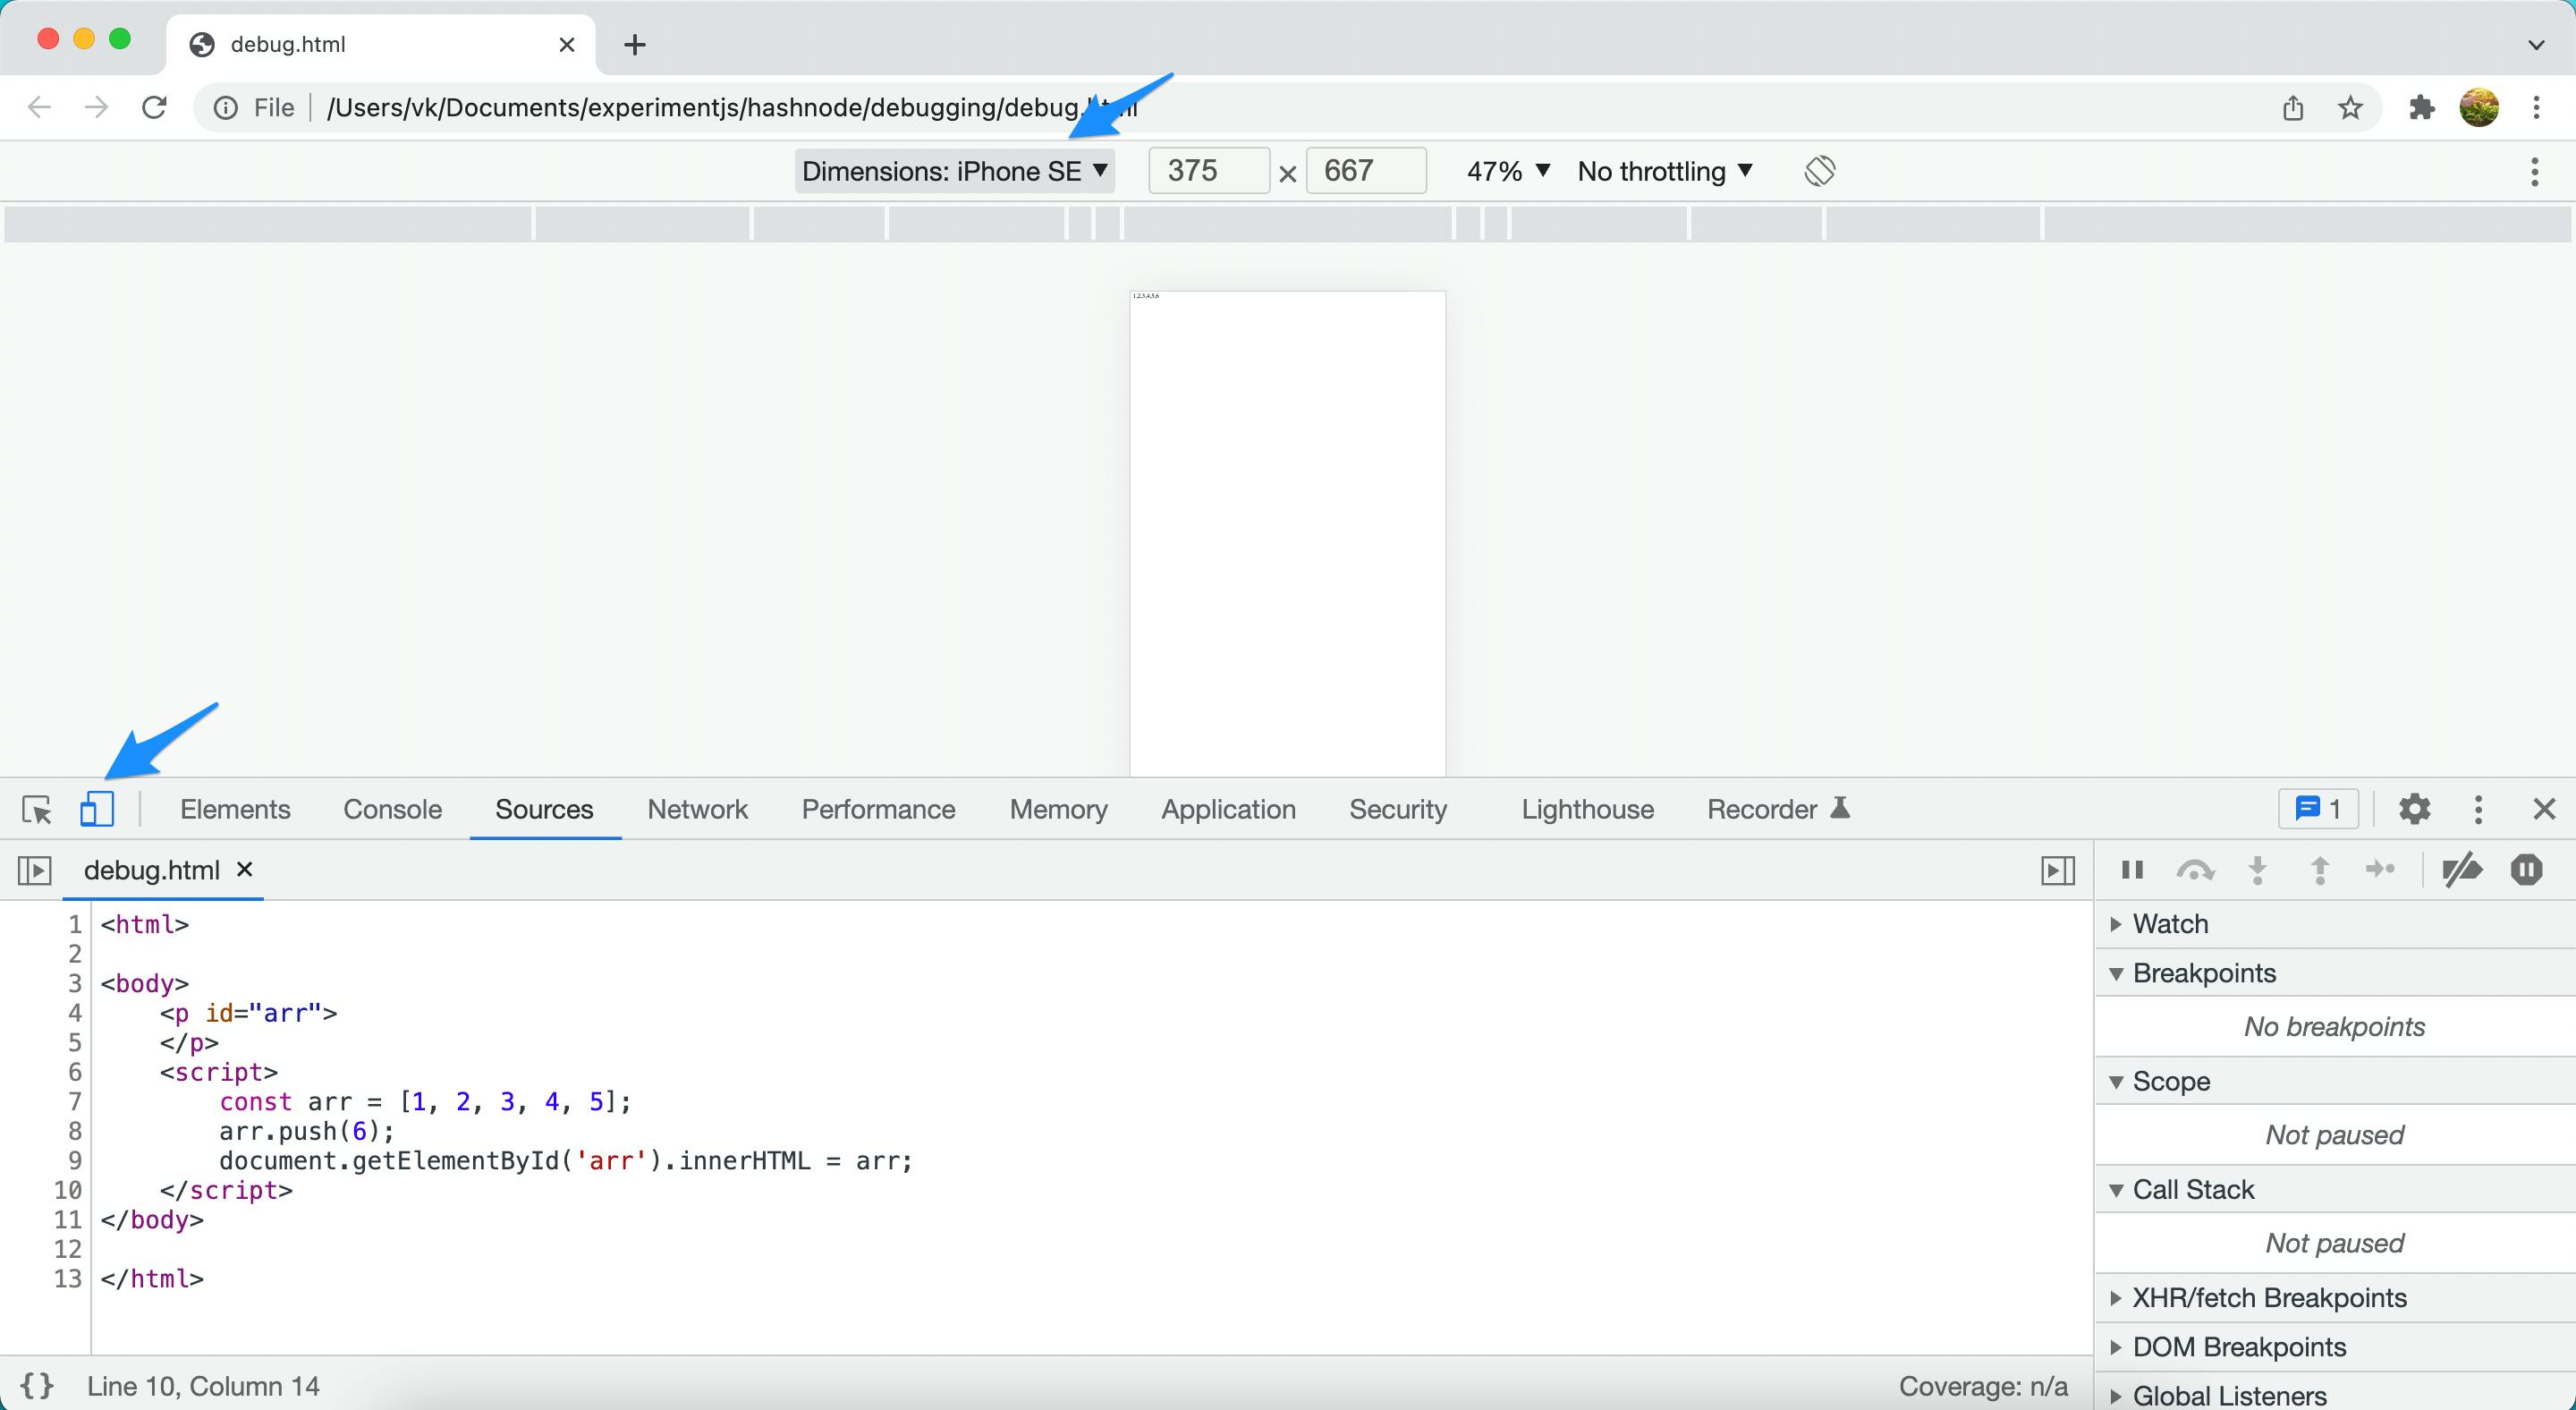
You can also verify how your UI looks in different devices in UI. Not technically a debugging code but if you are setting elements based on the resolution using javascript then you can use this feature.
Open developer tools -> Click on the 'Toggle Device Toolbar' option (shown in below screenshot) -> Your application is shown in device -> You can also switch to different devices using the top dropdown.
6. Watch Expressions feature
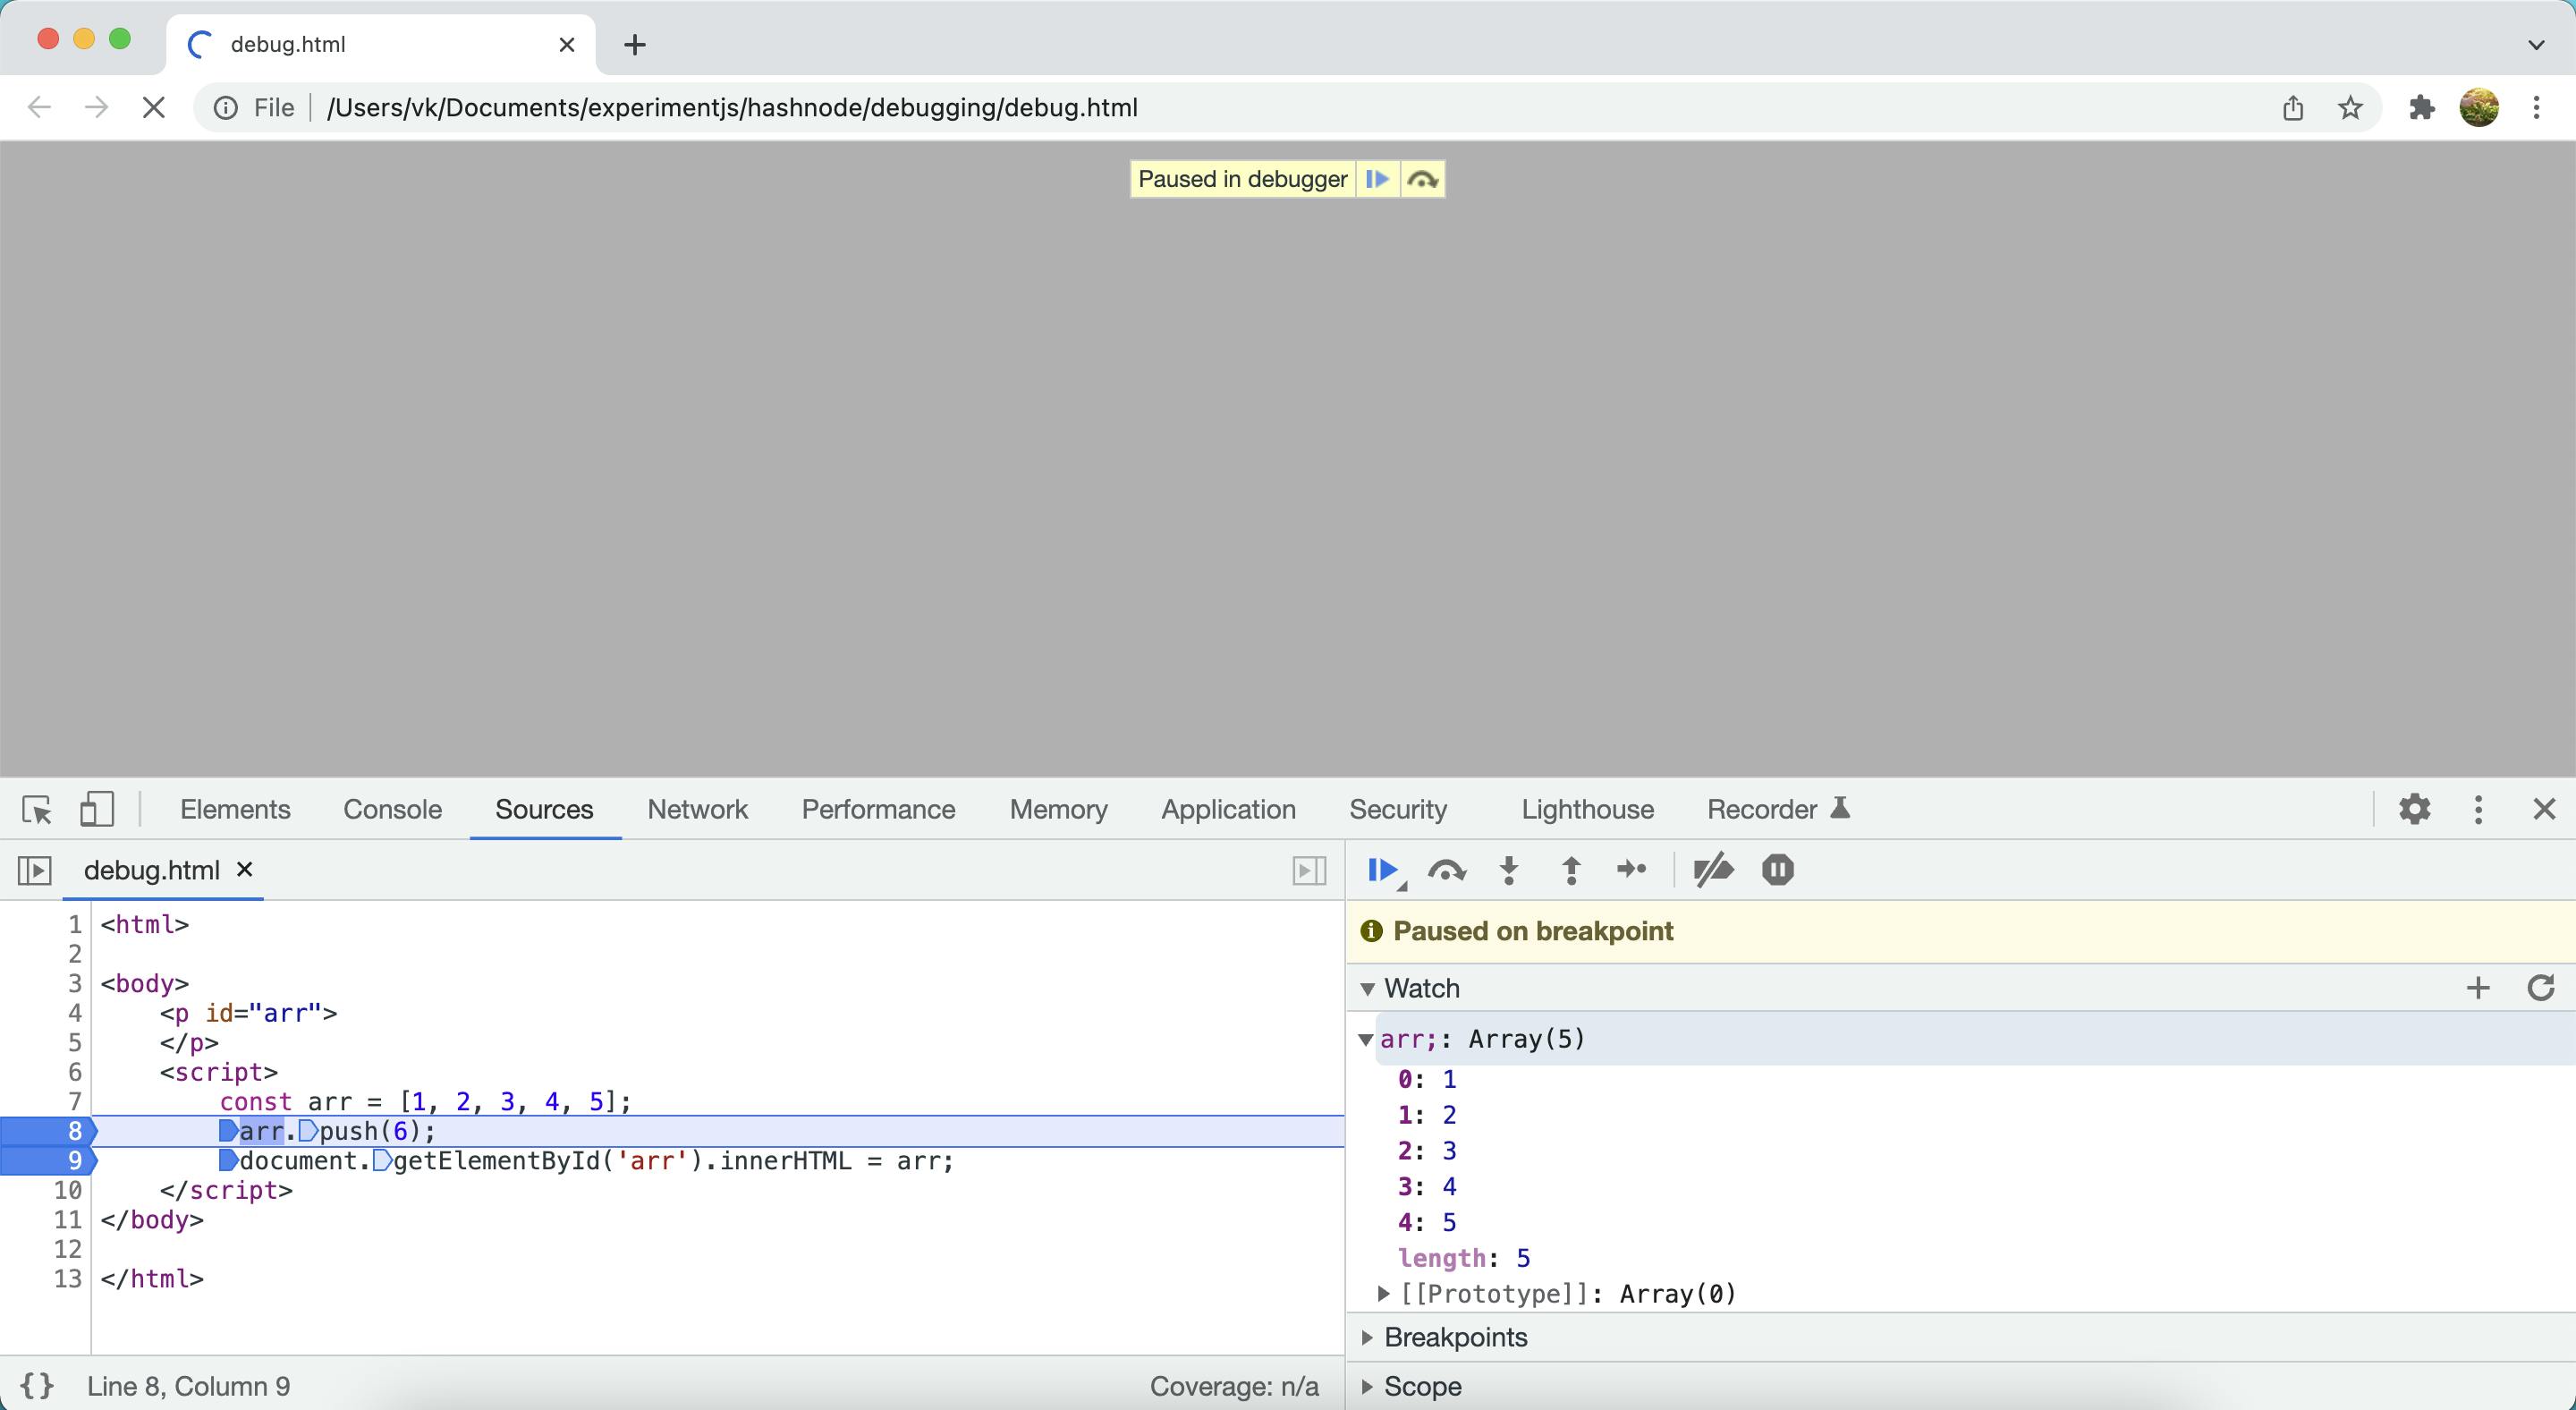
Watch expression feature in browser developer tools used to instantly validate the JS expression result over time while debugging the code.
`
See the arr values at breakpoint#8 and breakpoint#9. Over the period arr has been updated.
This watch expression is handier when you are dealing with complex logic.
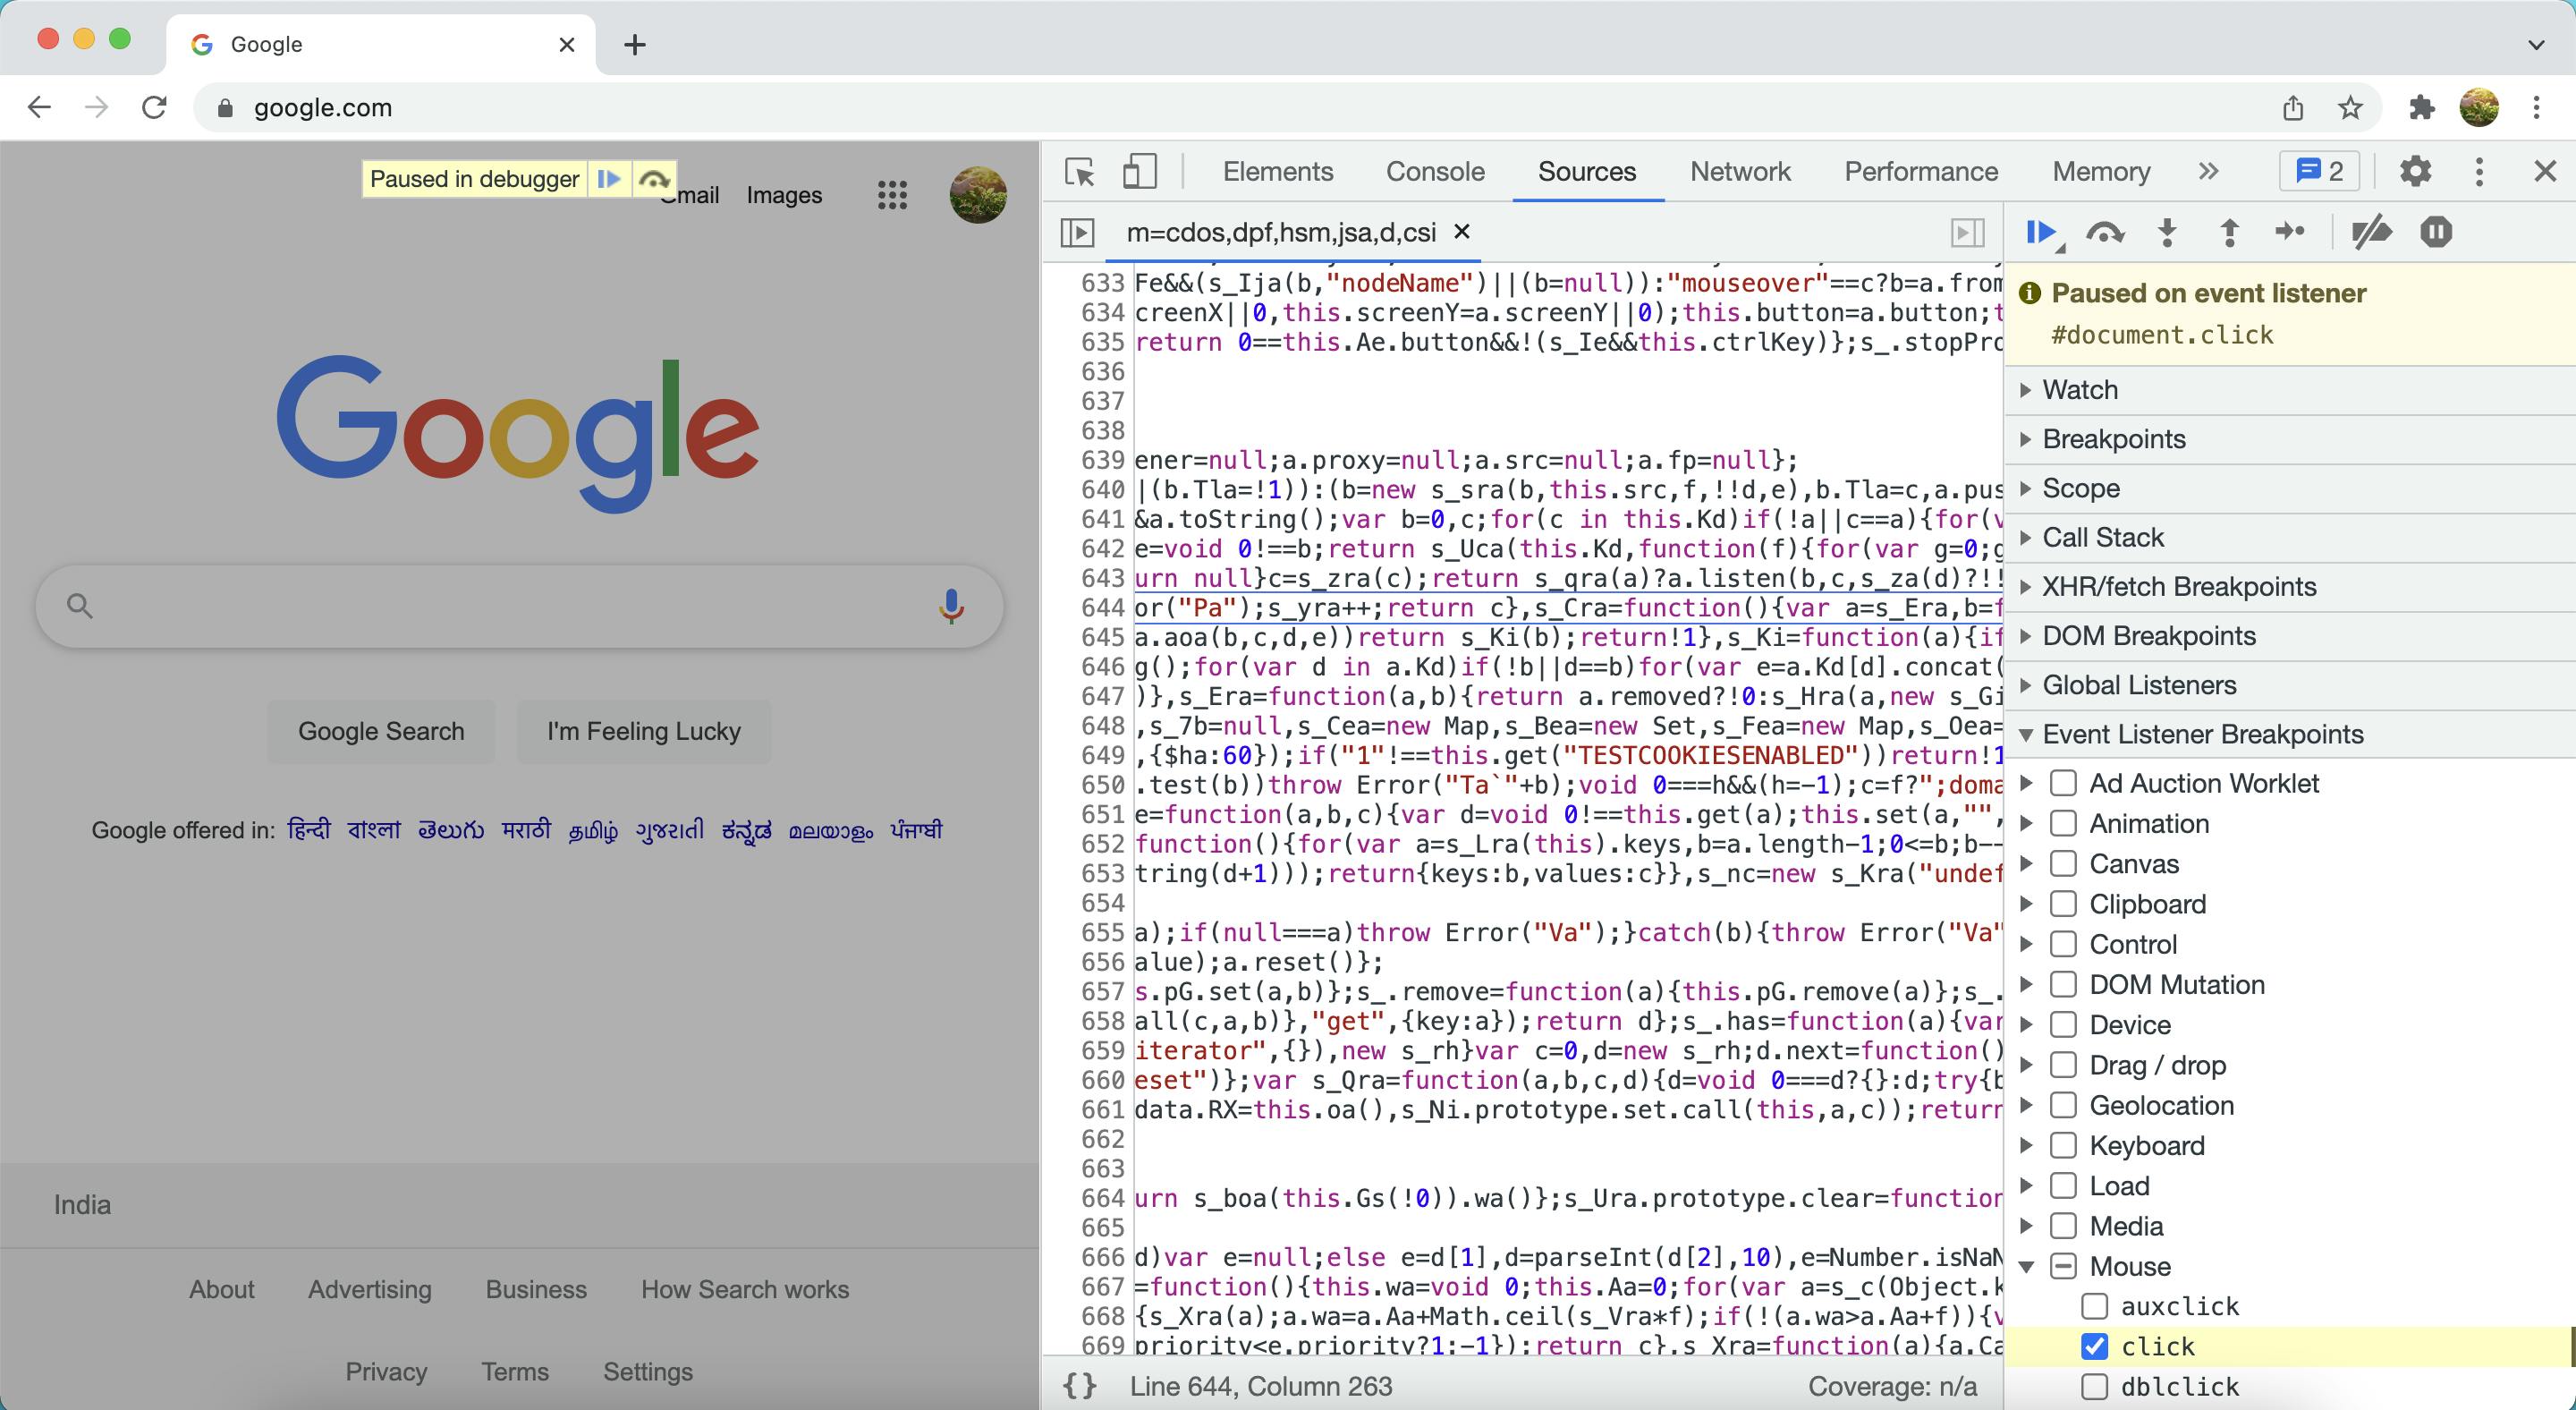
7. Event Listener Breakpoints
Just below of watch expressions feature there is Event Listener Breakpoints there you can have many actions to use as breakpoints.
Open Mouse triangle and check the 'click` event which lets you stop execution on click.
Not just mouse events, every other interaction with the application is listed there. We can use any event as a breakpoint.
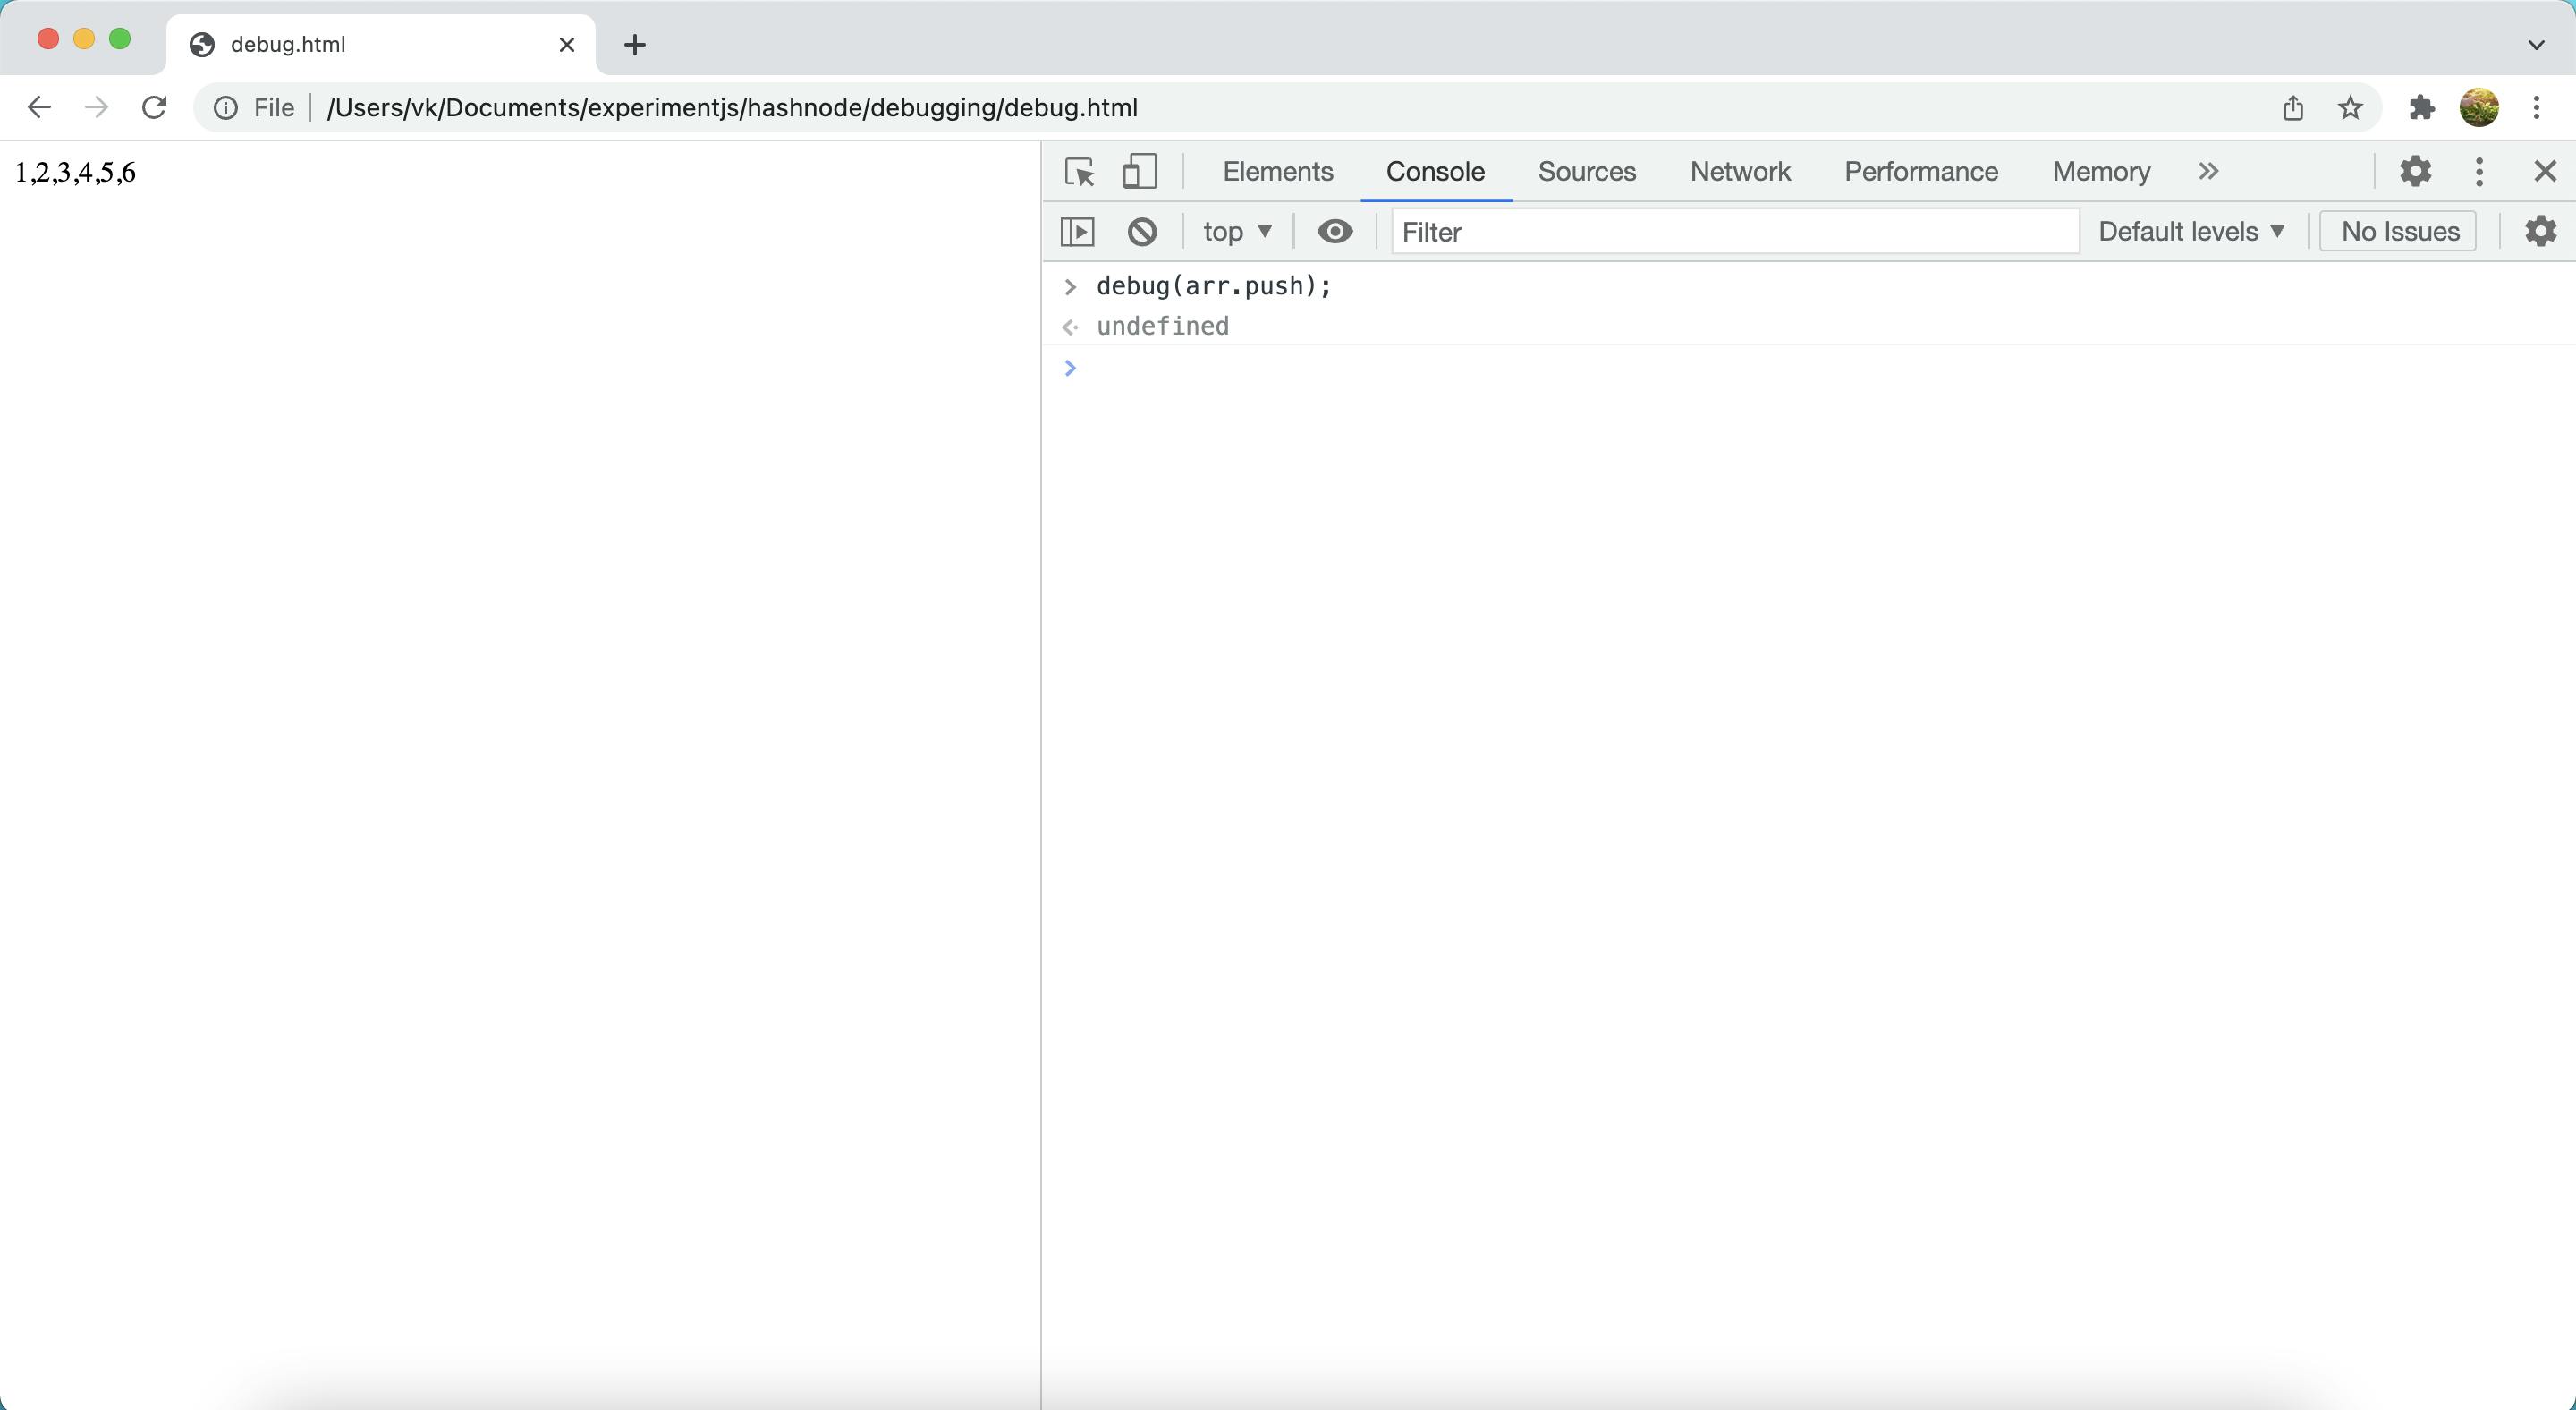
8. Use Debug from console
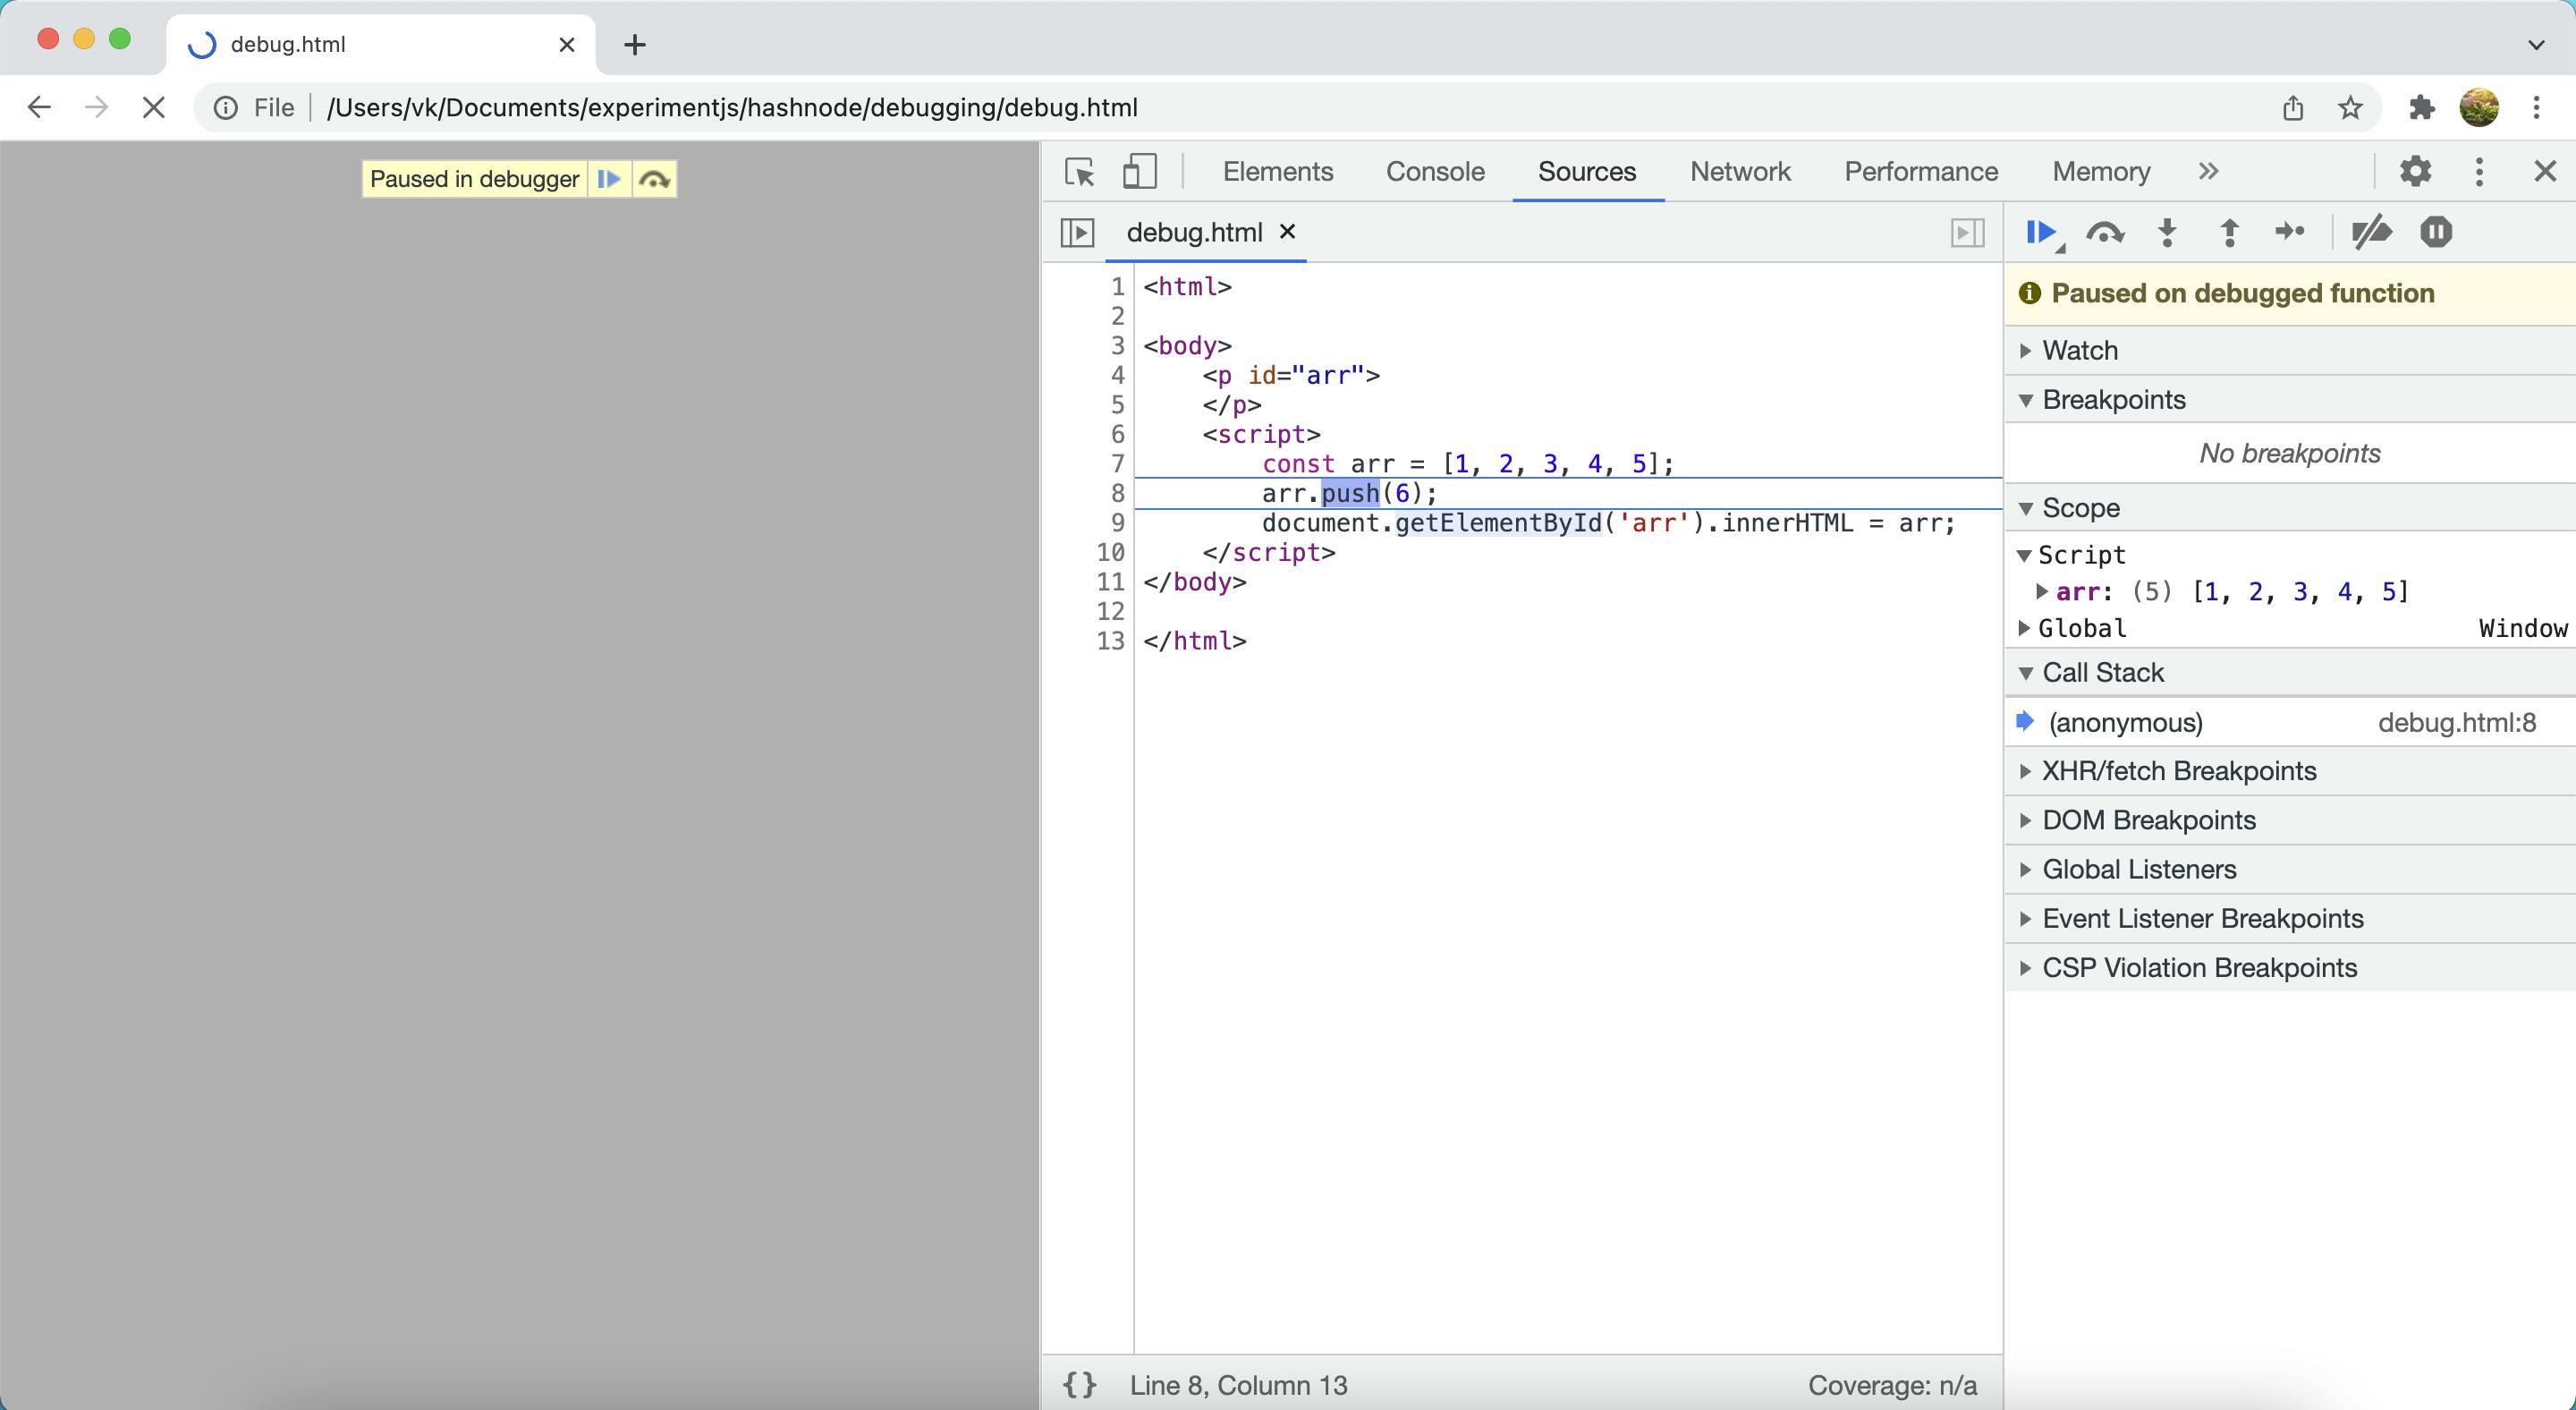
Manually type debug(function_name) in the console which lets you stop execution wherever the function executes.
Reload the page and observe that execution stopped at the mentioned function.
Thank you :) Happy reading!E

